
Last updated: September 16, 2026
Available with any of the following subscriptions, except where noted:
-
 Marketing Hub
Professional, Enterprise
Marketing Hub
Professional, Enterprise
-
 Content Hub
Professional, Enterprise
Content Hub
Professional, Enterprise
Analyze your personalized variants performance on the Analyze tab in the personalization tool. View a summary, comparison, and top performing personalized assets.
Please note: you can manage AI feature access in your AI settings and configure what data is shared. Review HubSpot's AI Trust FAQs and AI Model Cards for detailed information on AI security controls, data use, and compliance.
Analyze personalized variant performance
- In your HubSpot account, click More, then navigate to Marketing > Personalization. If More doesn't appear in your account, navigate to Marketing > Personalization directly.
- On the Personalization page, click the Analyze tab.
- On the Analyze tab, click the content type dropdown menu in the top left (e.g., Landing pages) to analyze a specific content type.
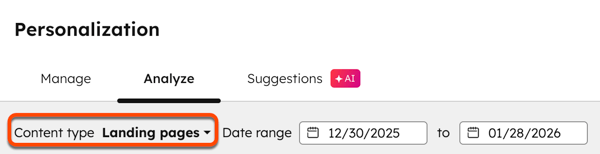
- To change the date range of the reports, select a date in the Date range fields.
- At the top of the page, you can view the Overview.
- The following metrics are displayed for CTAs:
- Views: the number of times your CTAs have been seen by visitors.
- Clicks: the number of button or link clicks for your CTAs. Any other clicks on the CTA won't be counted. Learn more about CTA performance metrics.
- Click rate: the percentage of views that lead to button or link clicks on the CTA. The click rate is the percentage of people who viewed, then clicked the CTA.
- The following metrics are displayed for pages:
- Views: the number of times the page content has been loaded on a web browser.
- Submissions: the number of form submissions on the page.
- Conversion rate: the percentage of visitors to a page who submitted a form. Learn more about page performance metrics.
- The following metrics are displayed for CTAs:
- To view top performing personalized assets, view the Highest performing assets table. Click the expand icon for a personalization to view the metrics for each variant.
- To compare non-personalized content to personalized variants, view the Personalization performance comparison (views) chart.
- To change the frequency of the chart, click the Frequency dropdown menu and select a frequency (e.g., Weekly) in the top right of the chart.
- Hover over a specific point on the chart to see a breakdown of its data.