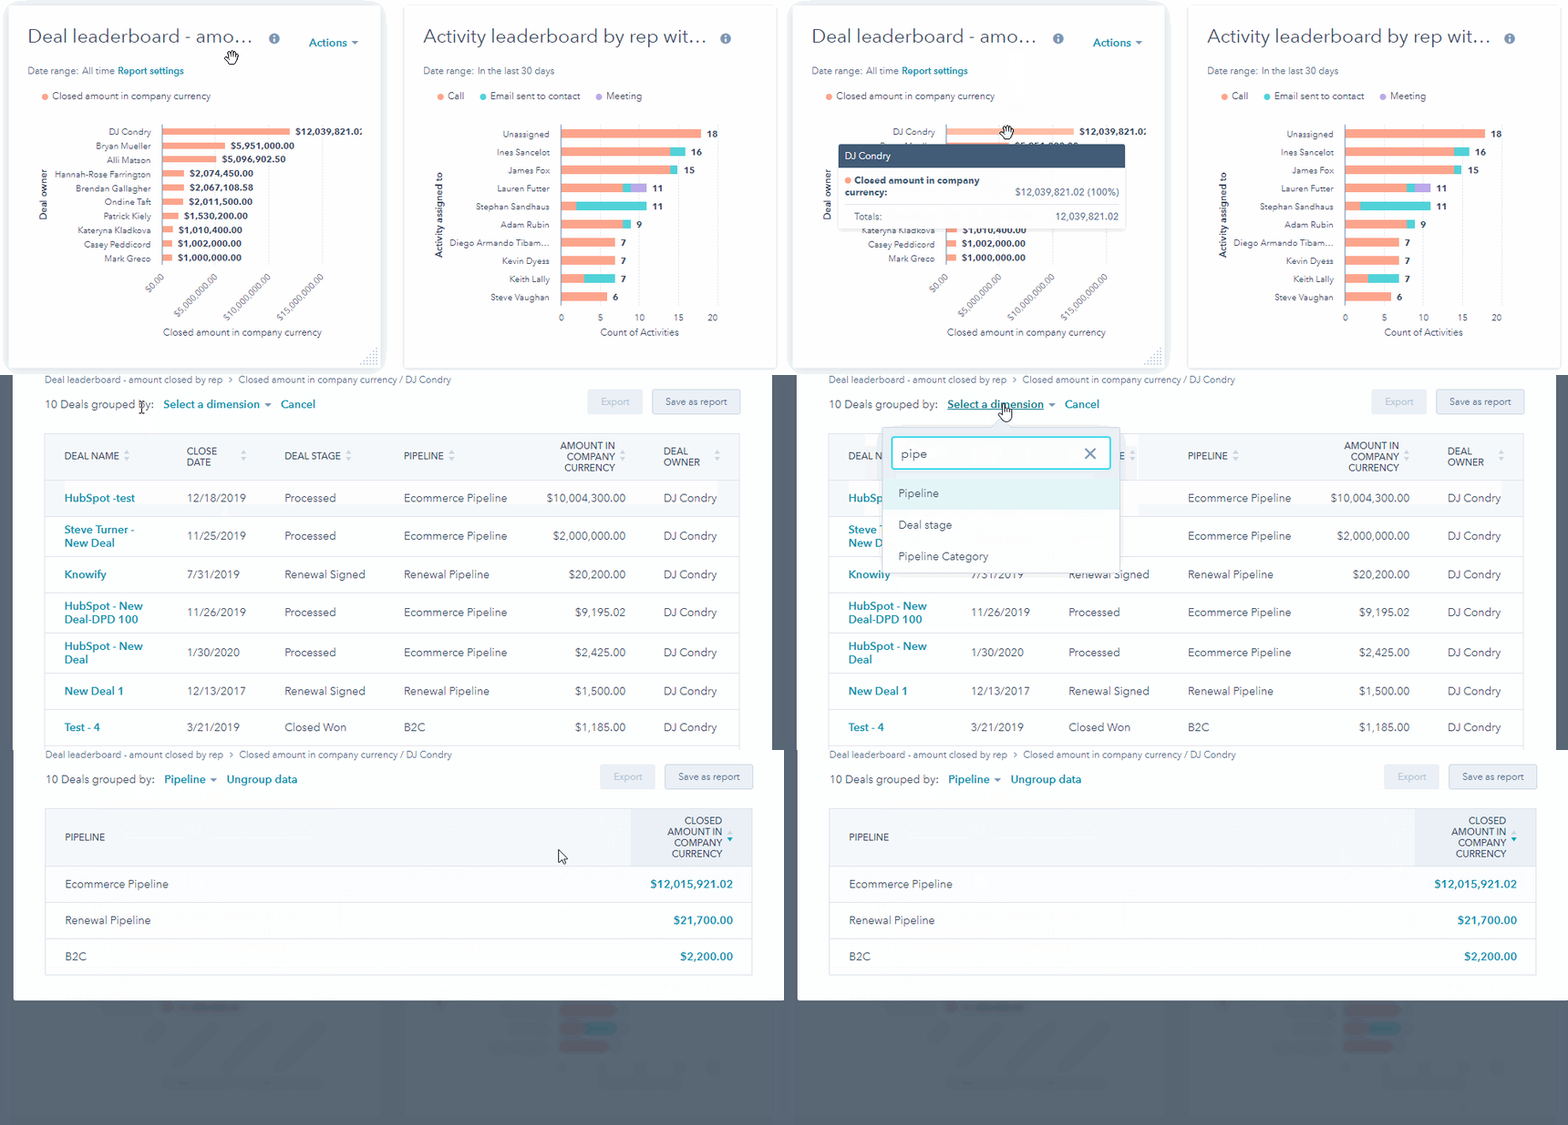
On your dashboard, you can drill into the metrics displayed in a report for more specific information on the records behind the data.
- In your HubSpot account, navigate to Reporting > Dashboards.
- To view another dashboard, click the dashboard name in the upper left, then select another dashboard in the dropdown menu.
- Locate the report that you want to drill into.
- Click a data point on the report to drill into that specific metric. In the dialog box, view details of the records or pages that contribute to that specific metric. To view an individual record or page, click the record name. You'll be redirected to a separate tab.
- To group data in the drill down, at the top, click Group data and select a property. For example, when looking at a specific user's closed revenue, you can group the data by pipeline to view where they've the most success. This helps to make data more actionable.

Dashboards
