Last updated: October 24, 2025
Available with any of the following subscriptions, except where noted:
With the site speed dashboard, you can evaluate how well your website performs for visitors against key Web Vitals metrics. This data can be used to optimize load times and improve user experience.
Please note: the site speed dashboard can only analyze HubSpot-hosted content. It cannot analyze content hosted by external platforms.
Analyze domain or page performance
- In your HubSpot account, click your account name in the top right.
- In the dropdown menu, in the Account section, locate your account ID beneath your account name.
- In your browser, navigate to app.hubspot.com/site-speed/[account-id] and replace [account-id] with your account's ID. For example, if the account's ID is 0000001, the URL will be app.hubspot.com/site-speed/0000001.
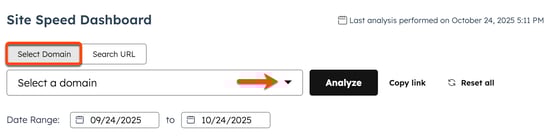
- To analyze a domain, click Select a domain at the top of the page.
- Click the Select a domain dropdown menu and select a domain.
- Click Analyze.
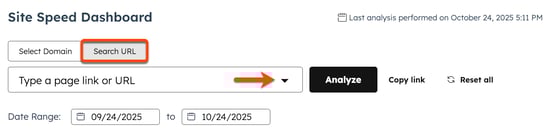
- To analyze an individual page, click Search URL at the top of the page.
- Click the Type a page link or URL dropdown menu and select a page or enter a URL for a page.
- Click Analyze.
- To set the date range, click the date picker and select a date range.
Understand site speed reports
On the site speed dashboard, you'll see the following reports:
- Performance Overall: analyzes the overall performance of your page or domain.
- Core Web Vitals Trends: tracks core web vitals, the key metrics that measure site speed. It's recommended to aim for Good core web vitals in 75% of visits.
- Sessions by country: tracks your core web vitals by the country associated with the visitor's IP address.
- Sessions by device type: tracks what percentage of your site visits are occurring on different devices.
- Largest Contentful Paint (LCP): measures the time it takes for the largest element on the page to render. For the best user experience, this element should appear within 2.5 seconds of the page starting to load for 75% of page visits.
- First Contentful Paint (FCP): measures the time it takes for the initial page render to complete. It helps calculate consumers' initial visual impressions.
- Time to First Byte (TTFB): measures the time it takes a user's browser to receive the first byte of a response from the server after making a request.
- Interaction to Next Paint (INP): measures the time it takes for your site to react to the visitor's first interaction (e.g., the visitor clicks a button).
- Cumulative Layout Shift (CLS): measures web page element stability. For example, buttons that change position before users can click them would contribute to a poor CLS score.
- Page Performance: shows core web vitals of individual pages.
- Render Strategy: measures to what degree your page visits are pre-rendered. Pre-rendered pages are static versions of pages that are stored locally to improve page loading speeds. Learn more about pre-rendering.