- Knowledge Base
- Commerce
- Payments
- Create advanced eCommerce reports
Create advanced eCommerce reports
Last updated: November 19, 2025
Available with any of the following subscriptions, except where noted:
-
Marketing Hub Professional, Enterprise
-
Sales Hub Professional, Enterprise
-
Service Hub Professional, Enterprise
-
Data Hub Professional, Enterprise
-
Content Hub Professional, Enterprise
-
Commerce Hub Professional, Enterprise
-
HubSpot Credits required for certain features
-
Additional subscriptions required for certain features
Gain deeper insights into your e-commerce customers by using HubSpot’s reporting and data tools. Learn how to create and use datasets, custom properties, and modules to better understand customer behaviors, segment your audience, track purchase history, and improve your sales and marketing strategies.
Use this article to set up loyalty scoring, analyze purchase patterns, and monitor shipping processes with step-by-step instructions for configuring datasets and custom reports. With these tools, you can segment contacts, personalize marketing, and generate actionable reports.
Before you get started
Before setting up the use cases, create an ecommerce pipeline on the Deal object with the following stages:
- Checkout pending
- Checkout abandoned
- Checkout completed
- Shipped
- Canceled
Subscription required A Data Hub Enterprise subscription is required to create datasets.
Permissions required Super Admin permissions, or Edit permissions for Data Studio are required to create or edit datasets.
Permissions required Super Admin permissions, or Sync permissions for Data Studio are required to sync datasets.
HubSpot Credits required for certain features HubSpot credits are required to sync and export datasets.
Permissions required Super Admin permissions, or Edit property settings permissions are required to create properties.
Customer loyalty rating
Use datasets to calculate a customer loyalty score, and filter the loyalty score further to add customers to tiers (e.g., most loyal customers in tier 1). Using the scores and tiers to build reports and segments, you can tailor your sales and marketing approach to your customers.
The loyalty score in the example is calculated as follows:
- Give a score of 5 if a contact has a deal that has closed within the last 60 days.
- Give a score of 10 if the contact's total revenue is above $100.
- Give a score of 10 if the contact's average page views are greater than three.
- Give a score of 5 if the contact's number of visits to your website is greater than 8.
The tier formula is calculated as follows:
- Contacts with a loyalty score of 15 or above are ranked tier 1.
- Contacts with a loyalty score between 9 and 14 are ranked tier 2.
- Contacts with a loyalty score of less than 9 are ranked tier 3.
Adjust the values as needed for your use case.
Set up loyalty and tier scoring using datasets
To set up loyalty and tier scoring using datasets:
- In your HubSpot account, navigate to Data Management > Data Studio.
- In the upper right, click Create dataset. If adding this field to an existing dataset, at the top, click the Datasets tab. Then, click an existing dataset.
- Select Contacts as your primary object and click Continue.
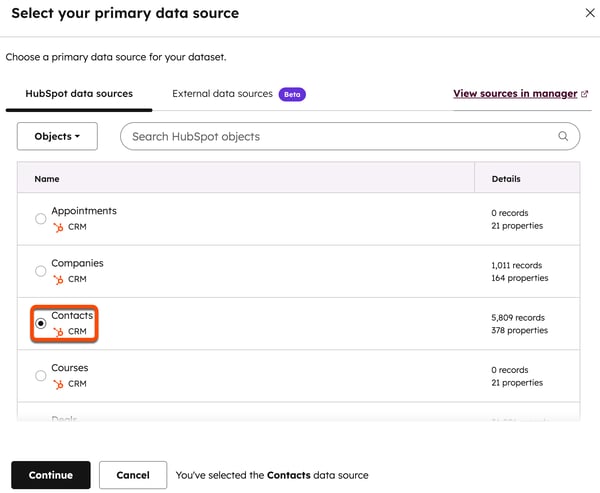
- In the right panel, click + Add source.
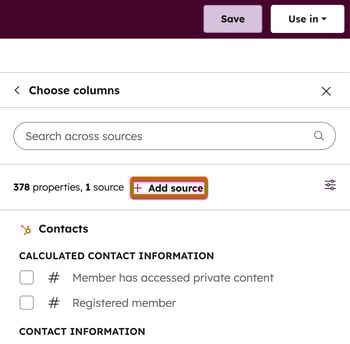
- Select Deals and click Continue.
- Click Columns in the right panel, then click + Create new column.
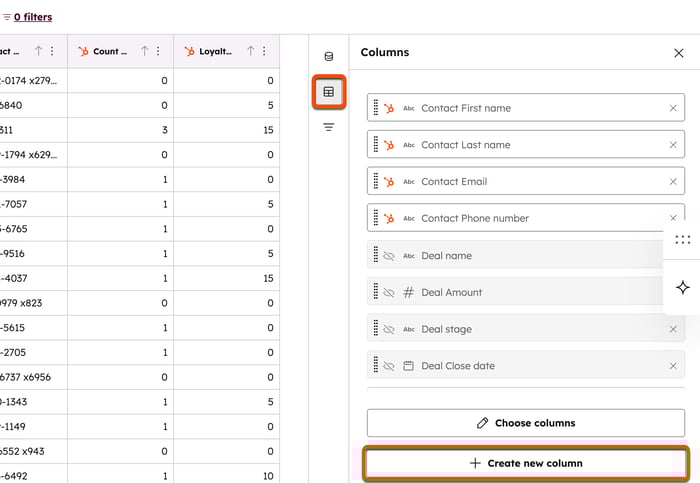
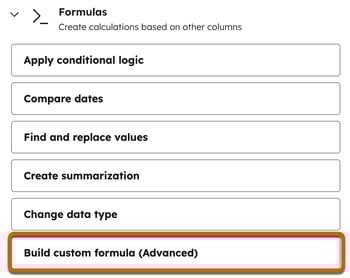
- Click Formulas to collapse the Formulas menu, then click Build custom formula (Advanced).
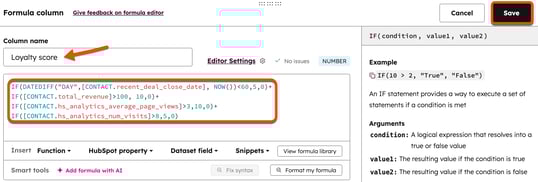
- At the bottom, in the Column name field, enter Loyalty score.
- In the editor box, enter the following:
IF(DATEDIFF("DAY",[CONTACT.recent_deal_close_date], NOW())<60,5,0)+IF([CONTACT.total_revenue]>100, 10,0)+
IF([CONTACT.hs_analytics_average_page_views]>3,10,0)+
IF([CONTACT.hs_analytics_num_visits]>8,5,0) - In the upper right of the formula window, click Save.
- Click + Create new column.
- Click Formulas to collapse the Formulas menu, then click Build custom formula (Advanced).
- At the bottom, in the Column name field, enter Loyalty tier.
- In the editor box, enter the following:
IF(
 [Loyalty score] >= 15,
 "Tier 1",
IF([Loyalty score] >= 9, "Tier 2", "Tier 3")) - In the upper right of the formula window, click Save.
- In the upper right, click Save to save the dataset.
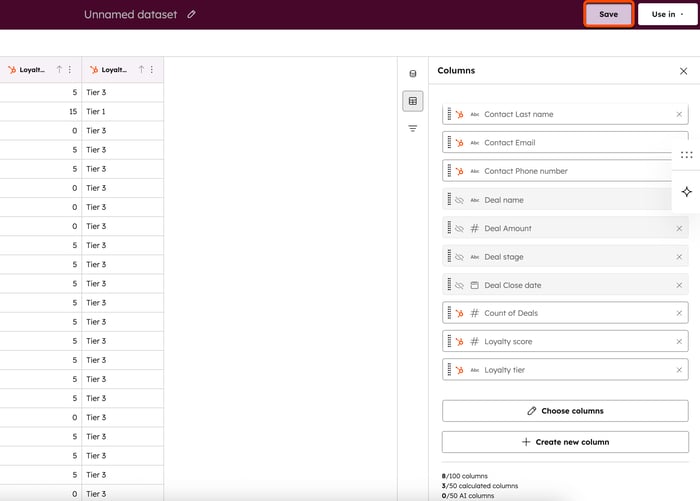
- Enter a name and description, then click Save.
- To use the dataset, in the upper right, click Use in downCarat and select an option.
Purchase history
Use custom properties and datasets to report on the purchase history of contacts. Report on:
- Average order total by basket size.
- Days since last purchase.
- Repeat purchasers vs single purchasers.
- Average purchase amount by original source.
Average order total by basket size
Use the average order total to find ways to increase average order value through upsell or cross-sell opportunities.
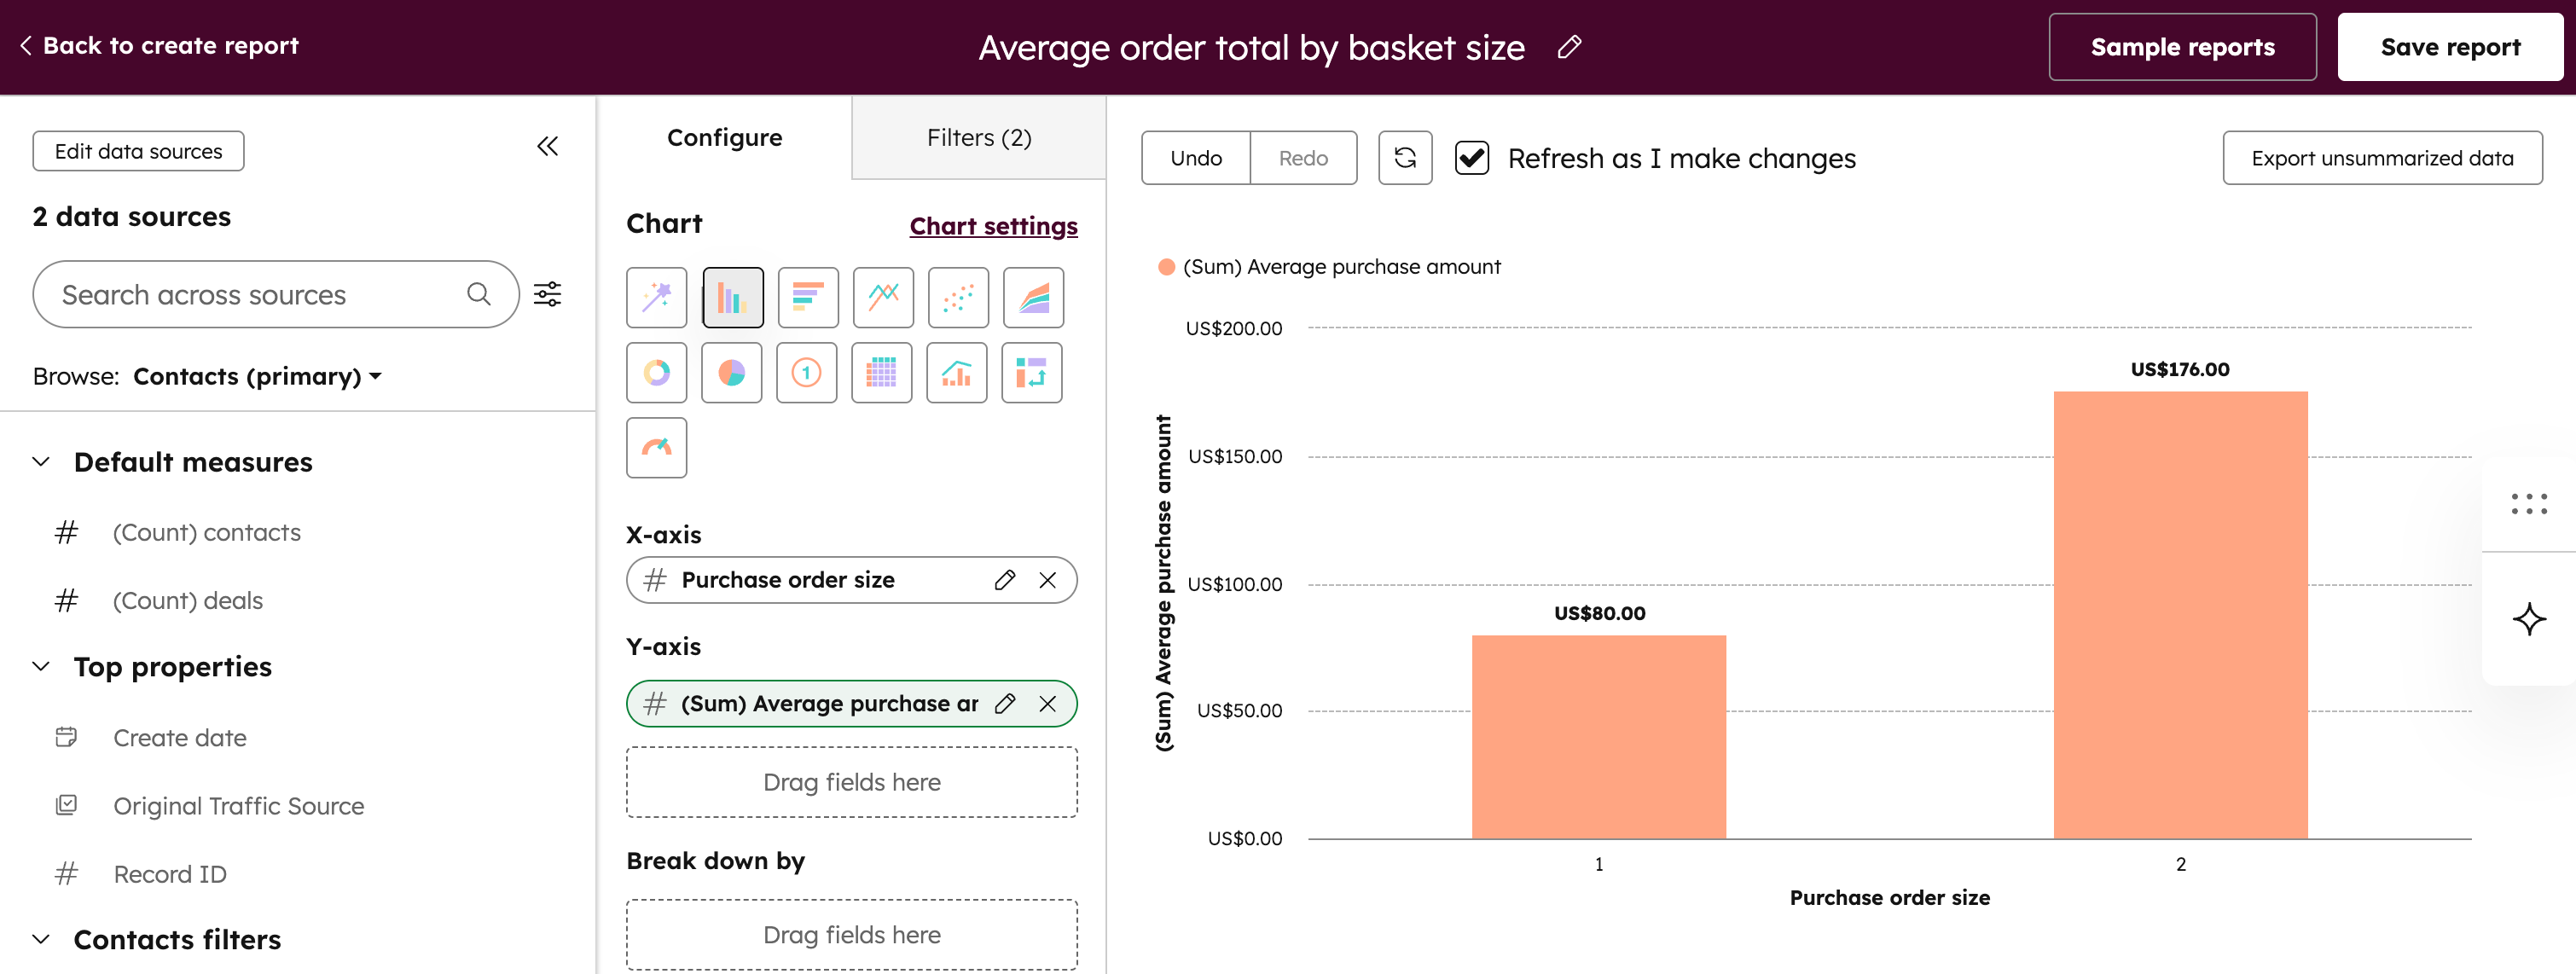
In this example, create two custom properties to calculate the average purchase amount and number of items purchased. Then, create a report to view contacts' average purchase amount, based on their order size (number of items purchased).
- Create a rollup property for the average purchase amount with the following attributes:
- Object type: Contact
- Field type: Rollup
- Rollup type: Average
- Number format: Currency
- Associated record type: Deal
- Associated record property: Amount
- Create a rollup property for the purchase order size with the following attributes:
- Object type: Deal
- Field type: Rollup
- Rollup type: Count
- Number format: Formatted or Unformatted number
- Associated record type: Line item
- Associated record property: Quantity
- Create a custom report with the following attributes:
- Primary data source: Contacts
- Additional data source: Deals
- Y-axis property: Average purchase amount
- X-axis property: Purchase order size
Days since last purchase
Use datasets to segment contacts based on how many days have passed since their last purchase. You can use the data in segments, email marketing, and other marketing channels, to stay engaged with customers who've previously purchased from you.
- In your HubSpot account, navigate to Data Management > Data Studio.
- In the upper right, click Create dataset. If adding this field to an existing dataset, at the top, click the Datasets tab. Then, click an existing dataset.
- Select Contacts as your primary object and click Continue.

- In the right panel, click + Add source.

- Select Deals and click Continue.
- Click Columns in the right panel, then click + Create new column.

- Click Formulas to collapse the Formulas menu, then click Build custom formula (Advanced).

- At the bottom, in the Column name field, enter Time since last purchase.
- In the editor box, enter the following:
DATEDIFF("DAY", [CONTACT.recent_deal_close_date], NOW()) - In the upper right of the formula window, click Save.

- In the upper right, click Save to save the dataset.

- Enter a name and description, then click Save.
- To use the dataset, in the upper right, click Use in downCarat and select an option.
Repeat buyers
Use datasets to segment contacts based on their number of purchases. You can use the data in segments, email marketing, and other marketing channels, to target customers for repeat purchases.
- In your HubSpot account, navigate to Data Management > Data Studio.
- In the upper right, click Create dataset. If adding this field to an existing dataset, at the top, click the Datasets tab. Then, click an existing dataset.
- Select Contacts as your primary object and click Continue.

- In the right panel, click + Add source.

- Select Deals and click Continue.
- Click Columns in the right panel, then click + Create new column.

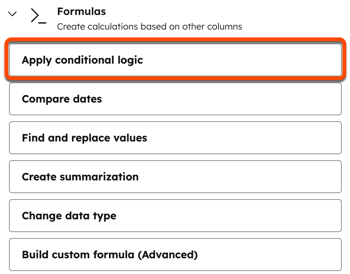
- Click Formulas to collapse the Formulas menu, then click Apply conditional logic.
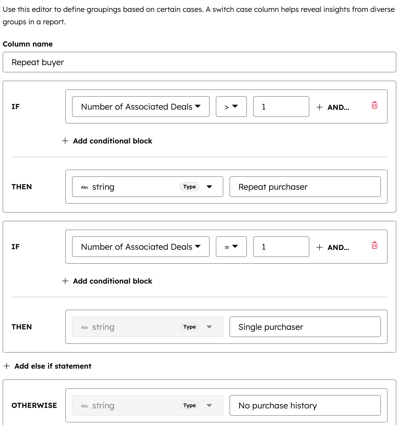
- At the bottom, in the Column name field, enter Repeat buyer.
- Next to IF:
- Click the Select property or column dropdown menu and select Number of Associated Deals.
- Click the = dropdown menu and select > (greater than).
- In the Enter value field, enter 1.
- Next to THEN:
- Leave the Type field as String.
- In the Enter value field, enter Repeat purchaser.
- Under the IF THEN statement, click + Add else if statement.
- Next to IF:
- Click the Select property or column dropdown menu and select Number of Associated Deals.
- Click the = dropdown menu and select = (equal to).
- In the Enter value field, enter 1.
- Next to THEN:
- Leave the Type field as String.
- In the Enter value field, enter Single purchaser.
- Next to OTHERWISE:
- Leave the Type field as String.
- In the Enter value field, enter No purchase history.
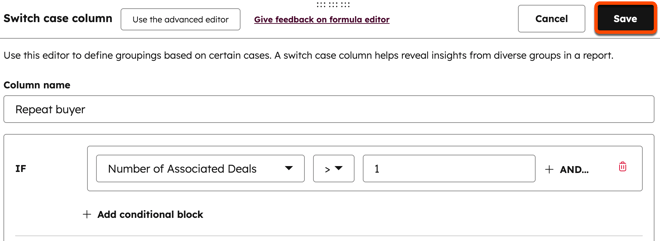
- In the upper right of the formula window, click Save.
- In the upper right, click Save to save the dataset.

- Enter a name and description, then click Save.
- To use the dataset, in the upper right, click Use in downCarat and select an option.
Average purchase amount by original source
Use an average purchase amount by original source calculation to analyze purchase amounts by channel (e.g., direct traffic, referrals, paid social).
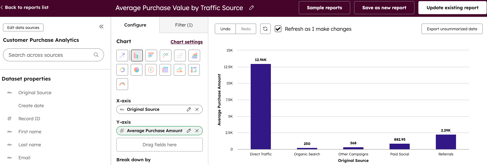
In this example, create a custom property to calculate the average purchase amount. Then create a report to view contacts' average purchase amount by original source.
Please note: if you previously set up a custom property for average purchase amount for the average order total by basket size use case, you can use the same property for this use case, and don't need to create an additional custom property.
- Create a rollup property for the average purchase amount with the following attributes:
- Object type: Contact
- Field type: Rollup
- Rollup type: Average
- Number format: Currency
- Associated record type: Deal
- Associated record property: Amount
- Create a custom report with the following attributes:
- Primary data source: Contacts
- Additional data source: Deals
- Y-axis property: Average purchase amount
- X-axis property: Original traffic source (deal property)
Shipping and logistics
Use datasets to report on the duration to ship and how many orders have overdue shipping.
Duration to ship and overdue shipping
In this example, set up a custom property and use it in a workflow to record the time and date when the checkout was completed. Create a dataset field to calculate the duration to complete shipping, and a field to calculate when shipping is overdue. The fields can then be used in reports.
- Set up your pipeline.
- Create a custom property with the following attributes:
- Label: Checkout complete timestamp
- Object type: Deal
- Field type: Date and time picker (show date and time only) and allow any dates.

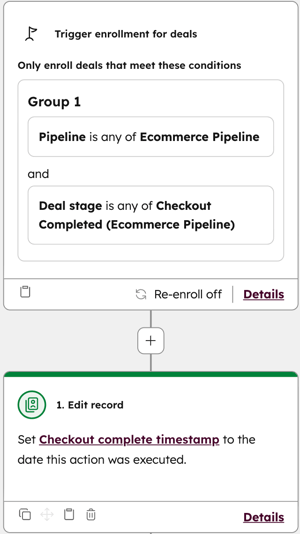
- Create a workflow that has the following trigger and action:
- Trigger: Deal is in the Ecommerce pipeline and is at the Checkout completed stage.
- Action: Set the Checkout record timestamp property to the date that checkout was completed.
- In your HubSpot account, navigate to Data Management > Data Studio.
- In the upper right, click Create dataset. If adding this field to an existing dataset, at the top, click the Datasets tab. Then, click an existing dataset.
- Select Contacts as your primary object and click Continue.

- In the right panel, click + Add source.

- Select Deals and click Continue.
- Click Columns in the right panel, then click edit Choose columns.
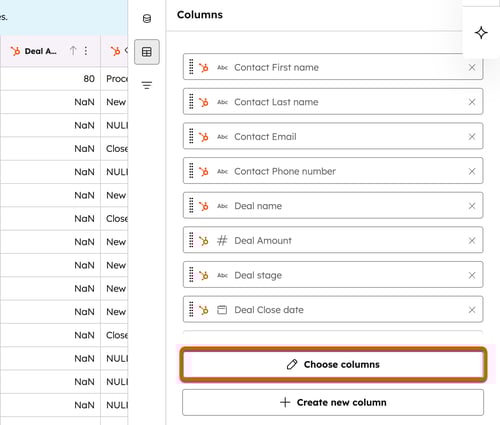
- In the right panel, click Deals to collapse the deal properties and select the Record ID and Region checkboxes.
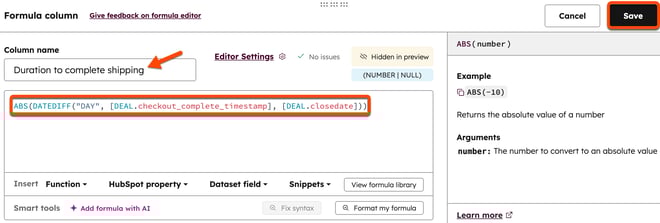
- Click Formulas to collapse the Formulas menu, then click Build custom formula (Advanced).

- At the bottom, in the Column name field, enter Duration to complete shipping.
- In the editor box, enter the following:
ABS(DATEDIFF("DAY", [DEAL.checkout_complete_timestamp], [DEAL. closedate])) - In the upper right of the formula window, click Save.
- Click Columns in the right panel, then click + Create new column.

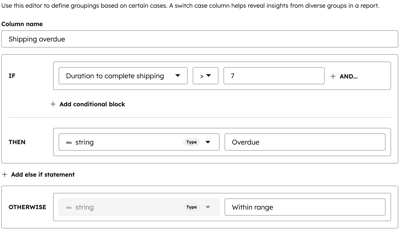
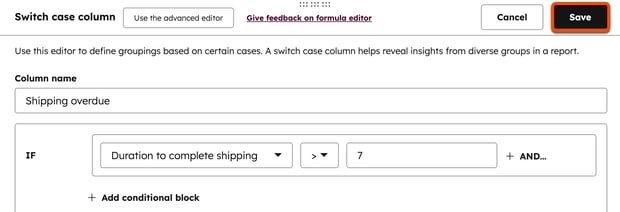
- Click Formulas to collapse the Formulas menu, then click Apply conditional logic.

- At the bottom, in the Column name field, enter Shipping overdue.
- Next to IF:
- Click the Select property or column dropdown menu and select Duration to complete shipping.
- Click the = dropdown menu and select > (greater than).
- In the Enter value field, enter 7.
- Next to THEN:
- Leave the Type field as String.
- In the Enter value field, enter Overdue.
- Next to OTHERWISE:
- Leave the Type field as String.
- In the Enter value field, enter Within range.
- In the upper right of the formula window, click Save.
- In the upper right, click Save to save the dataset.

- Enter a name and description, then click Save.
- To use the dataset, in the upper right, click Use in downCarat and select an option.
- You can then create a custom report with the following attributes:
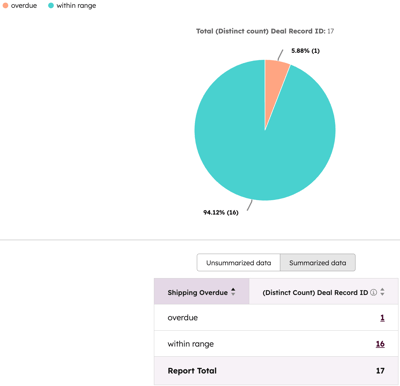
- Overdue shipping rate report:
- Primary data source: the dataset you created
- Overdue shipping rate report:
-
-
- Chart type: Pie
- Values: Deal Record ID (distinct count)
- Break down by: Shipping overdue
- Shipping overdue by region report:
- Primary data source: the dataset you created
- Chart type: Pie
- Values: Shipping overdue
- Break down by: Deal region
- Average duration to complete shipping:
- Primary data source: The dataset you created
- Chart type: Vertical bar
- Y-axis: Duration to complete shipping (average)
- Break down by: Deal region
-
Product gross profit breakdown by audience or product
Use datasets to break down products by product audience or product name, so you can see which audiences or products are providing the best returns.
- In your HubSpot account, navigate to Data Management > Data Studio.
- In the upper right, click Create dataset. If adding this field to an existing dataset, at the top, click the Datasets tab. Then, click an existing dataset.
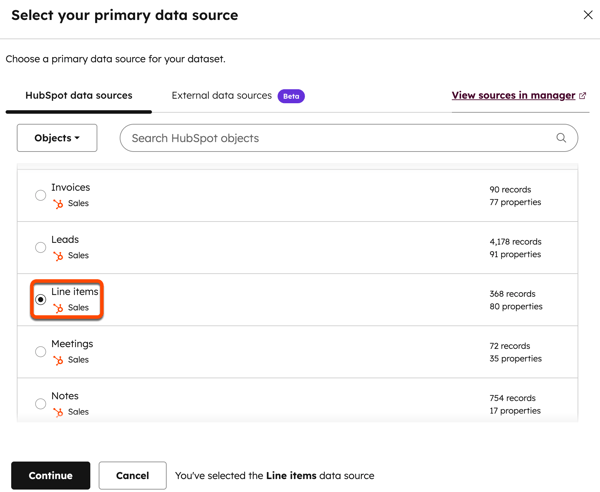
- Select Line items as your primary object and click Continue.
- In the right panel, click + Add source.

- Select Deals and click Continue.
- In the right panel, click + Add source.
- Select Contacts and click Continue.
- In the Deal stage column, take note of the Shipped stage ID number.

- Click Columns in the right panel, then click + Create new column.

- Click Formulas to collapse the Formulas menu, then click Build custom formula (Advanced).

- At the bottom, in the Column name field, enter Gross profit.
- In the editor box, enter the following:
IF([Deal stage]=="Shipped ID number (e.g., 57441674)", [Unit price] - [Unit cost], null) - In the upper right of the formula window, click Save.

- In the upper right, click Save to save the dataset.

- Enter a name and description, then click Save.
- To use the dataset, in the upper right, click Use in downCarat and select an option.
Customer journeys and behaviors
Page views by product type
Subscription required An Enterprise subscription is required to use custom events.
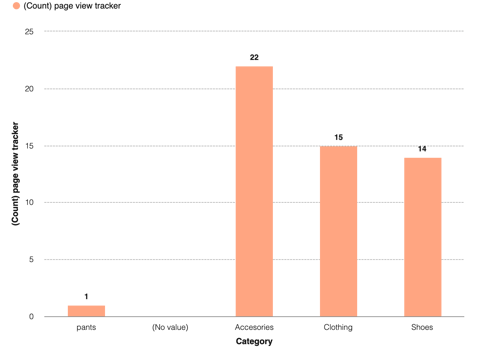
Use custom events to track views of products and categorize them using a custom property. Create a report to analyze which product type gets the most views.
- Create a custom event to track the views of a product. For this use case, it's recommended to create an event via API, or using JavaScript. If you need help setting up custom events, consider using a HubSpot Solutions partner.
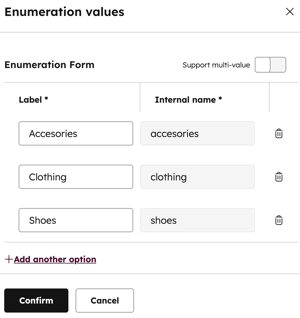
- When creating the custom event, create a custom enumeration property for your product types.
- Create a custom report for your custom event. In the report, plot the product types on the x-axis, and the custom event on the y-axis.
Customer purchase journey
Subscription required A Marketing Hub or Service Hub Enterprise subscription is required to create contact-based customer journey reports.
Use custom events to track touch points in a customer journey, including viewing a product, adding to cart, abandoning cart, and purchase. Add the custom events to a customer journey report to track conversions between each event.
Please note: if you previously set up a custom property for average purchase amount for the average order total by basket size use case, you can use the same property for this use case, and don't need to create an additional one.
- Create the following three custom events. For this use case, it's recommended to create an event via API, or use JavaScript. If you need help setting up custom events, consider using a HubSpot Solutions partner.
- Product views
- Cart status
- Checkout page tracker
- Add the custom events as stages to a customer journey report.

Send cart abandonment emails
Subscription required A Marketing Hub Professional or Enterprise subscription is required to use modules in marketing emails.
Keep customers engaged by sending personalized abandoned cart emails. In this example, use the Checkout abandoned pipeline stage in workflows to email buyers with abandoned cart items.
- Set up your pipeline
- Create a module in Design Manager. Add the following custom module syntax to the module (update the header and font styling as needed):
{#{{ module.deal.id }}#} {# Get the Contact associated to the Deal #} {% set associated_contact = crm_associations({{ module.deal.id }}, "HUBSPOT_DEFINED", 3, "orderBy=-createdate") %} {# Get the Line_Items associated to the Deal #} {% set associated_line_items = crm_associations({{ module.deal.id }}, "HUBSPOT_DEFINED", 19, "orderBy=-createdate") %} <h2 style="font-family:verdana; margin-top:20px; color:#ff6347; margin-left:10px; margin-right:10dp; text-align: center;"> Hello {{ associated_contact.results[0].firstname }}, Thank you for Visiting our Store! </h2> <p style="margin-left:10px; margin-right:10dp; text-align: center;"> We noticed that you haven't completed your order. Here is a little reminder of what you have in your current shopping cart. Feel free to complete your purchase by clicking on the button below. </p> {# Grab the product of each line item and display the info #} {% for item in associated_line_items.results %} {% set product = crm_object("product", item.hs_product_id, "name,price,hs_url", false) %} <div style="text-align:center"> <img style="width: 40%" src={{ product.hs_url }} /> <p> {{ product.name }} </p> <h4 style="font-family:verdana;"> ${{ product.price }} </h4> </div> {% endfor %} - Create a marketing email and add the module.
- Create a workflow that has the following trigger and action:
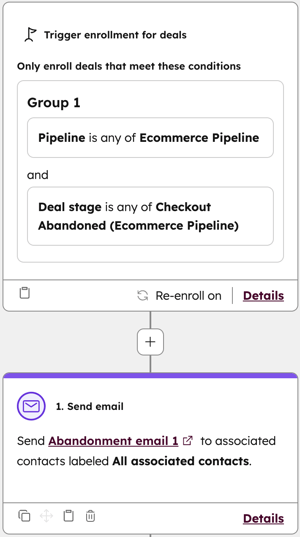
- Trigger: Deal is in the Ecommerce pipeline and is at the Abandoned cart stage. Turn on re-enrollment.
- Action: Send email.
