- Knowledge Base
- Reporting & Data
- Reports
- Analyze contacts with contact reports
Analyze contacts with contact reports
Last updated: September 3, 2025
Available with any of the following subscriptions, except where noted:
-
Marketing Hub Professional, Enterprise
Use contact reports to break down your contacts by source, lifecycle stage, country, create date, or activities. Analyze trends for a specific segment, saved filter, or across your entire contact database.
- In your HubSpot account, navigate to Reporting > Reports.
- In the left panel, click Contacts.
- Use the Date range dropdown menu to filter the data, based on the contact Create Date value, to a specific time range.
- If you select a rolling date range, the data set will exclude the current day.
- A week in the report starts on Sunday by default, when the date range selected consists of a week, or when the frequency is set to Weekly.
- On the right, click Export to export the data.
- In the dialog box, enter the Name of your file and click the File format dropdown menu to select a format. Click Export.
- The export file will be sent to your email address and can be downloaded in your notification center, accessed by clicking the notification icon in the top right.
- To save the chart as a report in your reports list, click Save as report on the right.
- In the dialog box, enter the Report name.
- To add the report to a dashboard, click the Add to dashboard dropdown menu and select if you want to add it to an existing dashboard or create a new custom dashboard.
- If you select Existing dashboard, click the Select existing dashboard dropdown menu and select the dashboard to add the report to.
- If you select New custom dashboard, enter the Custom dashboard name and click the Visibility dropdown menu to select if the dashboard should be shared, shared but read only to others, or private to your own user.
-
- Click Save & add.
- Click the Segment or saved filter dropdown menu to select a segment or saved filter to limit the contact data to.
Chart
- In the right panel, click the dropdown menu and select the metric you want to view in the chart.
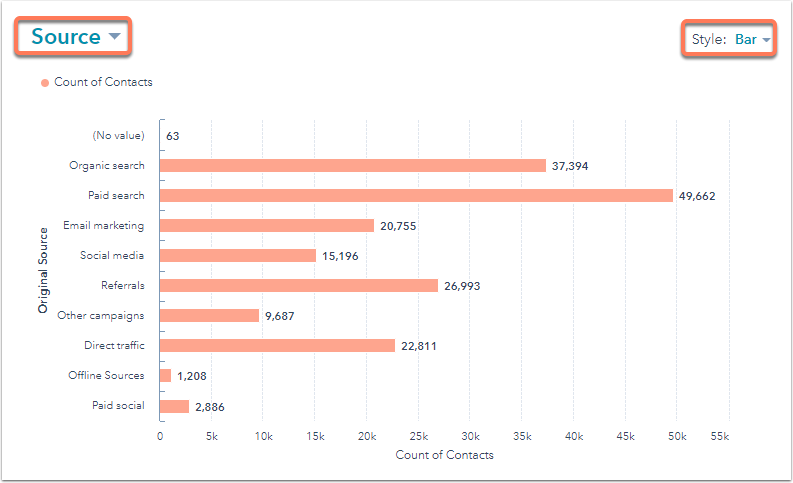
- Source: analyze the original source of your contacts. In the table view below, you can drill down into a specific source to see more details for each contact in your report.
- Lifecycle stage: analyze how your contacts are distributed across lifecycle stages in the buyer's journey.
- Country: analyze your contacts by country. This report is based on the IP country property value from a form submission.
- Create date: analyze your contacts by create date. This report is based on the year the contacts were added to your contact database.
- In the upper right of the chart, click the Style dropdown menu and select the type of chart you want to use for analysis. Depending on the metric you've selected, you can display your data as an area chart, column, line, or a combination of an area and line chart to visualize the data.

Table
The table displays the metric selected in the chart.- Click the Count of contacts to view the contacts included in each segment of your report. In the right panel:
- Click a contact name to open their contact record in a new window.
- Click Use in segment to create a new segment with these contacts, or add them to an existing segment.
- Click Export to email a file with these specific contacts.
- Click Go to Contacts to jump to a new saved filter of these contacts created with all the same criteria of your contacts analytics report.
Reports
Thank you for your feedback, it means a lot to us.
This form is used for documentation feedback only. Learn how to get help with HubSpot.