Last updated: September 8, 2025
Available with any of the following subscriptions, except where noted:
-
 Service Hub
Professional, Enterprise
Service Hub
Professional, Enterprise
-
 Seats required for certain features
Use service analytics reports to track your customer service team's success. Customize pre-built reports to monitor key metrics such as customer satisfaction scores, average ticket response time, and overall support volume.
View and save service reports
- In your HubSpot account, navigate to Reporting > Reports.
- In the left sidebar menu, click Service.
- You can view a report in one of the following ways:
- To view a report that answers your most relevant questions, under Quick Answers, click one of the questions. The report will then open.
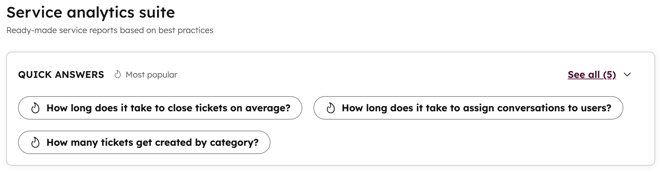
- To view all of the reports related to a topic area, in the left side panel, click the topic you want to analyze. Then, select a report you want to work with.
- To view a report that answers your most relevant questions, under Quick Answers, click one of the questions. The report will then open.
- In the middle panel, review the report you selected. Learn more about each report type below.
- For compatible reports, above the report, click the Over time or Totals tab to change the visualization.
- To apply filters to your report, above the report, select the available filters.
- To modify the settings of your report, click to expand the right side panel. On the Settings tab, apply any available filters:
- On the Charts tab, select any of the following:
- Show Metrics: toggle the Show Metrics switch on to see an overview of key data. Click Selected properties to select properties as options and data columns in the report in the dialog box. Then, click Apply.
- Chart type: select one of the available chart types to change the visualization of your data.
- Property: select the dropdown menus or Add a Property +, to select the key data in this report.
- Dimension: click the Dimension dropdown menu to choose how your data is grouped.
- Break down by: click the Brew down by dropdown menu to choose how your data is grouped.
- On the Charts tab, select any of the following:
-
-
- Frequency: click the Frequency dropdown menu to choose to show data daily, weekly, monthly, quarterly, or yearly. Frequency options may vary depending on the date range selected.
-
-
- On the Advanced tab, select any of the following:
- Trends: click the Trends dropdown menu to decide whether your data is linear, predictive, or logarithmic.
- Anomalies: toggle the Anomalies switch on to identify data points outside the expected range.
- Sort: click the sort dropdown menus to decide how you want your data sorted.
- On the Advanced tab, select any of the following:
- To read more about a report and how to use it, in the right panel, click the About tab.
- To refresh a report, click the Actions dropdown menu, then click Refresh.
- To share the customized report with other users, click the Actions dropdown menu, then click Copy report URL. You can share this report with all users who have access to service reports.
- To export a report, click the Actions dropdown menu, then select Export unsummarized data.
- To further customize the report, click Customize.
- Once you've finished customizing the report, save the report to your reports list or a dashboard by clicking Save report.
Types of service reports
Below are the service reports available in the report collections.
Customer Satisfaction
Seats required View-only seats do not have access to reports containing survey responses as a data source.
Customer satisfaction score (CSAT): the customer satisfaction (CSAT) scores submitted by customers after support interactions. Learn more about creating customer satisfaction surveys.
Team Performance
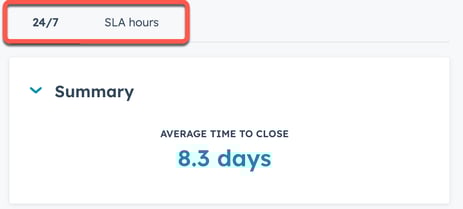
Average time to close: the average time it takes to close support tickets. Measures the length of time between when a ticket is created and when its Ticket status is set to Closed. Use the tabs at the top of the report to switch between the 24/7 and SLA hours view. The 24/7 tab shows SLA data without considering scheduled hours, while the SLA hours tab factors in the individual scheduled hours set for each SLA rule. Learn more about setting SLA goals in help desk.
Average time to first response (BETA): the average time it takes support reps to respond to tickets. Measures the length of time between when a ticket is created and when an agent first replied. Use the tabs at the top of the report to switch between the 24/7 and SLA hours view. The 24/7 tab shows SLA data without considering scheduled hours, while the SLA hours tab factors in the individual scheduled hours set for each SLA rule. Learn more about setting SLA goals in help desk.
Chat wait time: the average time that customers wait for responses over chat. Measures the length of time between when a customer starts a chat and when they receive an initial response.
Support volume: the total number of tickets by user in the selected time frame. Use this report to measure amount of tickets taken per support rep, and track support volume trends over time.
Ticket time in pipeline: view the average time that closed tickets spent in each stage of a particular pipeline by your users or teams over time.
Please note:
- The time_in_(X) properties calculate the difference between when the object first entered that pipeline stage until the last moment they were in that pipeline stage, regardless of the status(es) in-between these two times.
-
If a ticket is closed and then reopened, the count resumes each time a message is sent or received.
-
Reports include only Help Desk messages (e.g., chat replies, email replies).
Ticket replies
Customer reply time: view the average amount of time your customers took to reply to your service team in the help desk. Use this information to see when customer responsiveness may have slowed. Also, view the top ten customers with the longest reply times on average.
Customer wait time: view which of your customers are waiting the longest on average to receive a reply from your service team in the help desk.
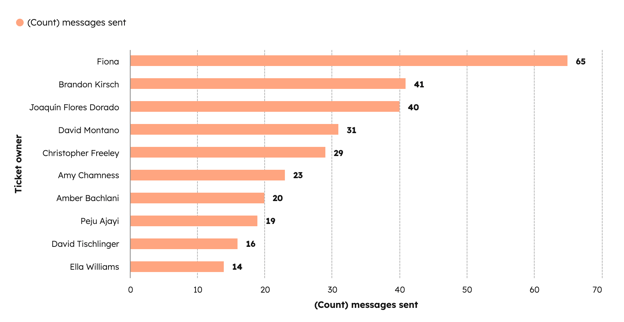
Owner reply count: view the total number of messages your service team sent to customers in the help desk. Use this information to view who is interacting the most with your customers in a given time frame.
Owner reply time: view the average amount of time your service team took to reply to your customers in the help desk. Use this information to see when responsiveness may have slowed. Also, view each ticket owner’s average reply time.
Ticket reply count: view the top ten tickets by volume of messages sent by your service team in the help desk and the top ten tickets by volume of messages received. Use this information to see if there are tickets that took more interactions to resolve.
Time of day: view the total volume of messages sent by your service team in the help desk and the total volume of messages received broken down by time of day. Use this information to see when your reps and customers were most engaged to help inform team planning.
Please note: time calculations on ticket replies consider the first message sent in a series of messages. For example, if a rep sends three consecutive messages without a reply, the calculation does not start over at the second or third message.
Planning
Working hours availability: view the total amount of time reps are available in and outside of their set user working hours. Use this information to understand if members of your team are working outside of their typical hours.
Maximum available rep: view the maximum number of users that were available to action support cases over the course of the day. Use this information to view how your team's availability changes throughout the day and if reps are working during peak times.
Rep availability: gain visibility into how your reps are spending their time by viewing their total availability. Look at this data at the top level or drill down further to see more detailed statuses. Use this information to assess and manage the workload across your team.