- Knowledge Base
- Data
- Data Management
- Build and activate datasets in Data Studio
BetaBuild and activate datasets in Data Studio
Last updated: January 6, 2026
Available with any of the following subscriptions, except where noted:
-
Data Hub Professional, Enterprise
Please note: if you're a Super Admin, learn how to opt your account into the beta.
HubSpot Data Studio consolidates external customer data to provide a unified platform for synchronization, integration, and activation across your technology stack. Users can build datasets from external sources like Google Sheets, Snowflake, and data sync apps, then integrate them into lists, workflows, and reports for efficient, data-driven decision-making.
Before you get started
- In order to view, edit, and use datasets, you must have Data Studio permissions.
- View and Edit permissions are turned on by default. Super Admin must turn on Use permissions for dataset users to let them use HubSpot Credits for Data Studio.
- Use permissions are only required when using a dataset in a workflow, segment, syncing to the CRM, or exporting.
- You can receive Data Studio sync notifications to stay updated on their status, allowing you to quickly take action if errors or unexpected failures occur, and ensuring the continued quality of data being updated in the CRM on a recurring schedule. Learn how to set up notifications.
- Learn more about subscription limitations in HubSpot's Product & Services catalog.
What is a dataset?
A dataset is a collection of data from across your HubSpot account that can consist of HubSpot and/or external data sources. A dataset can include properties for CRM objects and HubSpot assets, fields from external data sources, and formulas to calculate your data.
Learn more about dataset definitions in the Glossary.
Use cases for Data Studio
Below are key use cases demonstrating how you can leverage external datasets to enhance CRM records, optimize workflows, create dynamic customer lists, and use datasets to build reports.
Sync data from third-party applications
You can sync datasets from third-party applications directly to your HubSpot CRM. This allows you to:
- Update CRM records using external datasets
- Generate new properties from calculated formula fields
- Instantly write data to your CRM with one click
For example, you could blend data from a product usage platform (e.g. Mixpanel) with company datasets to create a powerful Product engagement score property in HubSpot.
Learn how to sync data from third-party applications.
Sync data to HubSpot's CRM
You can sync data to HubSpot's CRM to:
- Improve your audience segmentation
- Send more personalized marketing emails
- Improve your sales outreach based on learnings derived from data
For example, you could create a dataset that tracks customer behavior across different channels. By syncing this data back to the CRM, you can refine audience segmentation to identify high-intent leads. Using these insights, you can send personalized email campaigns tailored to customer preferences, boosting engagement and conversion rates.
Learn how to sync data to HubSpot's CRM.
Use your dataset in a workflow
You can use your datasets in a workflow to:
- Build one-time or recurring workflows for primary dataset records
- Incorporate dataset fields into workflow actions
For example, leverage the engagement score dataset to build a workflow that automates customer alerts for potential upgrades or churn risks. This workflow can also proactively reach out to customers who may be a strong fit for an upgrade.
Learn how to use datasets in a workflow.
Use your dataset to create segments
You can use your datasets to create segments to:
- Import and merge product usage, lead scores, and customer data into Data Studio
- Combine HubSpot contact data with external sources, refining insights with filters
- Generate a filtered list of dataset contacts that meet specific criteria
For example, leverage a targeted customer data dataset to generate a dynamic segment that drives an automated marketing campaign, delivering personalized customer experiences at scale.
Learn how to use your datasets to create segments.
Use your dataset in a report
You can use your datasets in a report to:
- Combine multiple data sources to create unified reports with information from your CRM, external applications, and analytics platforms
- Segment data dynamically by applying filters to focus on specific groups, behaviors, or trends
- Build custom metrics and calculations using formula fields to generate unique performance indicators.
For example, you could create a field to calculate annual recurring revenue based on the deal amount property, and then use this data from the dataset in a report to track revenue trends, forecast future earnings, and analyze customer retention over time.
Learn how to use your datasets in a report.
Export datasets to Google Sheets and Office 365 Excel
You can export datasets to Google Sheets and Office 365 Excel to:
- Maintain external copies for archival purposes or additional security.
- Work with your data even without an internet connection.
- Share datasets easily with team members for real-time edits and feedback.
For example, exporting HubSpot datasets to Google Sheets or Office 365 Excel allows businesses to refine data for clear insights into revenue trends and customer acquisition, then securely share it with external stakeholders without granting HubSpot access.
Learn how to export datasets.
Create a dataset
To create a dataset:
- In your HubSpot account, navigate to Data Management > Data Studio.
- Click Create dataset in the top right.
Data sources
Data sources are the basis of your dataset. Learn more about different data sources in the Glossary.
- On the Sources tab, under Select a primary data source, click Choose a data source.
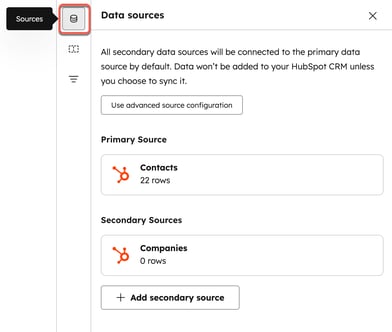
- On the Choose your data screen, select your primary data source:
- On the Synced sources tab, click a HubSpot data source, or a data source from a third-party application. To add a new source, click + New source, then follow the prompts.
- On the CSVs tab, click a CSV file to use as a data source. To add a CSV file, click + Upload new CSV, then follow the prompts.
- To add a secondary source, click + Add secondary source, then follow the steps above. Continue adding secondary sources as needed.
- To join additional data sources to construct a more complex data set, click Use advanced source configuration.
Advanced source configuration
To join another data source:
- Click Join another data source, or the + icon in the data source viewer.

- On the HubSpot data sources or External data sources tab, select a data source.
- Click Continue.
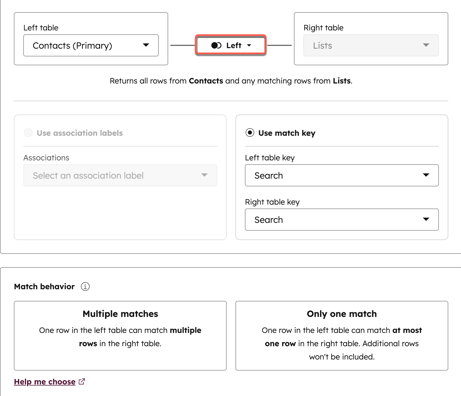
- On the Preview your join screen, configure the following:
-
- In the Left table box, it will display the primary source you selected.
- In the Right table box, it will display the additional source you selected.
- Click the Left dropdown menu to select Left join or Inner join.
- Left join: returns all rows from [primary data source] and any matching rows from [secondary data source].
- Inner join: returns rows that have matching values in both [primary data source] and [secondary data source].
- Click Use association labels or Use match key.
- Use association labels: select an association label for the join.
- Use match key: select a match key for the left table and right table.
- Under Match behavior, specify the relationship between the selected data sources:
- Multiple matches: one row in the left table can match multiple rows in the right table.
- Only one match: one row in the left table can match at most one row in the right table. Additional rows won't be included.
- Click Add custom join.
Columns
- On the Columns tab, drag and drop the columns to customize their order.
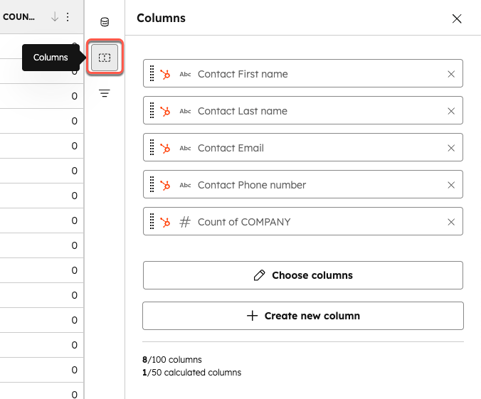
- To choose columns you want to appear in the dataset, click Choose columns, then click the checkboxes next to columns you want to make appear.
- To create new columns, click + Create new column. Explore the different column creation options below:
Data Agent
Use data agent to conduct research and generate new data:
- Click to expand Data Agent. Then, click Create smart column.
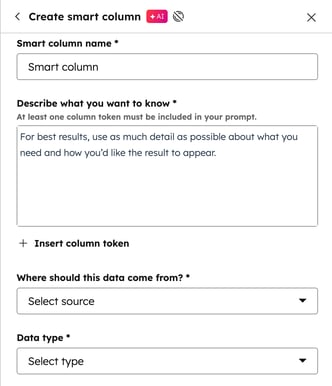
- In the Smart column name textbox, type the column name.
- In the Describe what you want to know textbox, write a description of the data you want to generate and extract from the smart column.
- Click + Insert column token to reference other properties within the dataset.
- Click the Where should this data come from? dropdown menu to select a source for your data.
- Web research: data from searching the internet.
- Company research: data from the company's primary website.
- Dataset columns: data from another column in the dataset.
- Click the Data type dropdown menu to specify the kind of information in the cell (e.g., number, text, or date).
- String
- Number
- Boolean
- Click Preview.
- The smart column will now appear in the table.
Enrichment
Use Enrichment to fill gaps or validate data:
- Click to expand Enrichment. Then, click Enrich [primary data source] columns or Enrich [secondary data source] columns.

- Click the Column for [data source] [property] dropdown menu, to select the column property you want to enrich.
- Under Select columns to be created, click the checkboxes next to the properties. You can also use the search bar to find properties.
- Click Preview or Create [#] columns.
Formulas
Use Formulas to create calculations based on other columns:
- Click to expand Formulas. Then, click one of the following:
-
- Apply switch case
- Compare dates
- Find and replace
- Formula builder (Advanced)
- Summary measure
- In the bottom panel, fill in the formula fields.
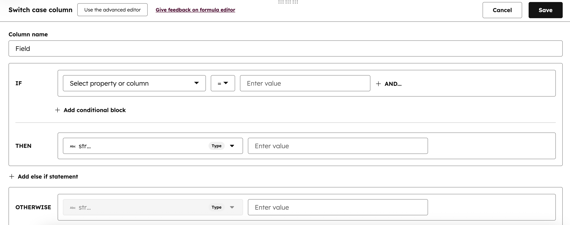
- Then, click Save.
Modifiers
Use Modifiers to apply formatting changes and normalizations:
- Click Apply capitalization, then do the following:
- Click the Column to reference dropdown menu to select a column.
- Type a name in the New column name textbox.
- Under Choose capitalization, click Title case, UPPERCASE, or lowercase.
- Click Create column.
- Click Trim whitespace, then do the following:
- Click the Column to reference dropdown menu to select a column.
- Type a name in the New column name textbox.
- Click Create column.
Summarized and unsummarized views
There are two types of views that are used to view your datasets:
- Summarized view: the view for a dataset that's created when it has more than one data source and there are multiple matches possible between the primary and secondary data sources. This view will show data grouped by primary data source and will be used in CRM sync, workflows, and lists. Only columns available in the summarized view will be available in CRM sync, workflows, and lists.
- Unsummarized view: the view for a dataset that displays ungrouped data.
Please note: in cases where there's only one source or there's a one-to-one relationship between different sources (e.g., example@hubspot.com appears once in Snowflake and once in your HubSpot CRM), you will not be presented with a summarized or unsummarized view of your dataset, and the dataset can be used for reporting, CRM syncs, workflows, and lists. Learn how to configure your data join settings.
Filters
Apply filters to your dataset.
- On the Filters tab, apply Row Level Filters, Aggregate Filters, and Group Summary Filters to your dataset.
- Click the Include data if it matches dropdown menu, then select ALL of the filters below, ANY of the filters below, or Custom filter rules.
- Click + Add filter, then click a filter from the pop-up box. Continue adding filters as needed.

Review dataset
Once you have completed customizing your dataset, you can do the following:
- Review the table to make sure your dataset is appearing correctly.
- Click the Summarized view dropdown menu, and select one of the following:

-
- Summarized view: shows data grouped by the primary source. This is used for CRM syncs, workflows, and lists.
- Unsummarized view: shows ungrouped data with rows for all sources This is used for reporting.
- If you are satisfied with your dataset, click Save. Click Use in to create a report, workflow, list, do a CRM sync, or export your dataset.
Glossary
Data sources
Data sources include CRM objects (e.g., contacts, custom objects), assets (e.g., website pages, emails), and activities (e.g., conversations, sales) you want to report on. You can select up to five per dataset.
The primary data source anchors the dataset, with all other sources linking to it. HubSpot connects them using the shortest path, automatically joining related data like contacts and deals without extra steps.
Other data sources require intermediary connections for integration. For example, if Deals is the primary source and blog post data is needed, HubSpot links them via Contacts and Web activities, automatically selecting the necessary sources.
Additional data sources
You can add secondary data sources to your dataset to consolidate information into a single view. Some sources will integrate automatically, while others may require additional input to establish a connection.
Automatic joins
Automatic joins are available for common HubSpot data combinations (e.g., Companies + Deals) and integrations with sync apps (e.g., Contacts + Stripe Invoices).
When selecting these source pairs, rows are automatically matched using a default column, typically Email Address or Company Domain.
To customize the matching column, you can manage the join in the source panel.
Custom joins
When integrating data from sources with flexible column structures—such as Google Sheets, AirTable, CSVs, and warehouses—you must provide additional details to enable data merging.
If a custom join is required, you'll need to select matching columns from each source. This ensures that data aligns correctly, using common identifiers such as email addresses, IDs, or company domains.
Syntax
Within a function, you can use data from properties and fields or literal data. Property and field data will be dynamic based on the individual data sources, while literal data is constant. For example:
2021-03-05is a literal date, which is constant.[CONTACT.createdate]is a property-based date, which is dynamic for each contact record.
Functions can include both literal and property/field data, as long as the data types are compatible with the function’s required arguments. For example:
DATEDIFF("MONTH", "2021-01-01", “[CONTACT.createdate]”)
Below, learn about the syntax for literals and property/field data, and how to incorporate them into formulas.
Literal syntax
Use literals to add specific, static strings of text, numbers, true or false values, and dates in your calculations.
- String literal: text surrounded by quotation marks. For example,
“My cool string”.
- Number literal: numbers without quotation marks. For example,
42. - Boolean literal:
trueorfalse. - Date literal: a string formatted as
"YYY-MM-DD", or a date timestamp number (e.g,1635715904).
Property syntax
Property references allow you to directly include values from the properties of your selected data sources. You don't need to add the property as a dataset field to reference it.
Use the following syntax when referencing properties:
- Reference expressions are always surrounded by square brackets (
[and]). - Property references specify the object or event name, followed by a period and the internal property name. For example:
[CONTACT.lifecyclestage][COMPANY.name][e_hs_scheduled_email_v2.__hs_event_native_timestamp]
Field reference syntax
You can reference fields in a formula by surrounding the field name with square brackets. For example:
-
[Field 1][My awesome custom field]
You can reference fields in formulas as long as the formula’s operators and functions accept the field’s data type. For example, if you create a new field that contains a string, you can reference the field in a function that accepts strings:
- If Field 1 is
[DEAL.name], it contains a string value (the deal's name). CONCAT([Field 1], "Q4")would be valid because it contains two string values.CONCAT([DEAL.name], 2012)would not be valid because it contains both a string and a number value.
Operators
You can use operators with literal and property/field values, and operators are evaluated in the standard PEMDAS order of operations. This allows you to nest operators using parentheses. For example:
- Adding a number with a property reference:
1 + [DEAL.amount] - Using parentheses to nest operations:
(1 + 2) * (3 + 4)
| Operator | Description | Example usage |
|
|
Add numbers. Returns a number. |
|
|
|
Subtract numbers. Returns a number. |
|
|
|
Multiply numbers. Returns a number. |
|
|
|
Divide numbers. Returns a number. |
|
|
|
Negates a number. |
|
|
|
Checks if both of two boolean values are true. Returns a boolean. |
|
|
|
Check if either of two boolean values are true. Returns a boolean. |
|
|
|
Negatives a boolean value. Returns another boolean value. |
|
|
|
Equality operator. Returns a boolean value. |
=true= true |
IF
IF logic is a set of rules performed if a certain condition is met. You can use IF logic to differentiate data. For example, you can use IF logic to:
- Calculate different commissions based on the size of a deal (i.e. give a higher % for a bigger deal).
- Bucket deals into tiers for analysis and action in your reports.
- Translate feedback responses into categories (e.g. label 1-6 is detractor).
- Define contact priority based on how many days they’ve been marked as lead.
LABEL
The LABEL function converts enumeration property interval values into user-friendly values. Some HubSpot defined properties, such as Deal and Contact owner are represented as internal values. This make analysis difficult. When used with HubSpot's defined properties that support translation, the LABEL function will provide the translation based on portal settings, not user settings. For example, you can use the LABEL function to:
-
Access contact or deal stage names directly in fields
LABEL([DEAL.dealstage]) = "Closed Won"(10)
- Reference HubSpot owners by name directly in fields
LABEL([DEAL.hubspot_owner_id]) = "John Smith"
Numerical functions
| Function | Definition | Arguments | Example usage |
|
|
Compute the absolute value of a number. Returns a number. |
number: the number to take the absolute value of. |
|
|
|
Round a decimal value up to the nearest integer. Returns a number. |
number: the number to take the ceiling of. |
|
|
|
Divide a number, but return zero when the divisor is zero. Returns a number. |
dividend: the number to use as a dividend in the division operation. divisor: the number to use as a divisor in the division operation, with zero resulting in a zero value overall |
|
|
|
Computer Euler's number raised to a value. Returns a number. |
exponent: the exponent to raise Euler’s number to. |
|
|
|
Round a decimal value down to the nearest integer. Returns a number. |
number: the exponent to raise Euler’s number to. |
|
|
|
Compute the natural logarithm of a value. Returns a number. |
number: the value to take the natural logarithm of. |
|
|
|
Compute the logarithm of a value within a specified base. Returns a number. |
base: the base to be used in the logarithm calculation of the value. value: the number to take the logarithm of. |
|
|
|
Raise a base value to a specified power. Returns a number. |
base: the number to compute the power of. exponent: the number to raise the base by. |
|
|
|
Take the square root of a non-negative number. Returns a number. |
number: the number to take the square root of. |
|
|
|
Bin numerical values into buckets of equal width. Returns the number of the bucket that the value falls into. If returned value is below the minimum, returns zero. If returned value is above the maximum, returns the number of buckets +1. |
value: the number to compute in the bin number. minValue: the minimum value to start binning from. maxValue: the maximum value to bin to. bucketCount: the desired number of equal-width buckets to bin values into between minValue and maxValue. |
|
String functions
| Function | Definition | Arguments | Example usage |
|
|
Determine whether a string contains a case sensitive substring. Returns a boolean value. |
string: the string value to test. substring: the value to check for inside the string. |
|
|
|
Concatenate two strings. Returns a string. |
string1: the string value to which string2 will be appended. string2: the string value to append to string1. |
|
|
|
Compute the length of a string. Returns a number. |
string: the string value to calculate the length of. |
|
|
|
Remove leader and trailing whitespace from a string. Returns a string. |
string: the string value to trim whitespace from. |
|
Date functions
| Function | Definition | Arguments | Example usage |
|
|
Create a date value from year, month, and day parts. Returns a date. |
year: the year part of the desired date. month: the month part of the desired date. day: the day part of the desired date. |
|
|
|
Return the number of time units between the first date value and the second for a specified time unit. Returns a number. |
datePart: the year, quarter, month, week, or day unit to use in the difference calculation. date1: the starting date value to subtract from date2. date2: the ending date value that date1 will be subtracted from. |
|
|
|
Extract the year, quarter, month, week, or day from a date value. Returns a number. |
datePart: the year, quarter, month, week, or day unit to extract. date: the date value to extract a date part from. |
|
|
|
Truncate a date value to its year, quarter, month, week, or day. |
datePart: the year, quarter, month, week, or day unit to truncate to. date: the date value to truncate. |
|
|
|
Create a timestamp value from year, month, day, hour, minute, and second parts. Returns a datetime value. |
year: the year part of the desired date. month: the month part of the desired date. day: the day part of the desired day. |
|
|
|
Calculate the week number within a year for a date. Returns a number. |
date: the datetime value with which to compute the week number within a year. |
|
|
|
Returns the current time based on your account's timezone. Returns a datetime value. |
|
|
|
|
Returns the number of week days (Monday - Friday) between two dates. |
value1: the starting datetime value. value 2: the ending datetime value. |
|