Last updated: July 12, 2024
Available with any of the following subscriptions, except where noted:
|
|
|
|
As a manager, you can use the forecast tool to keep track of your team's progress towards their goals. By default, the forecast tool uses deal stages to forecast revenue based on their likelihood to close. If you set up forecast categories, deals can also be grouped into categories. This allows you and your team to adjust your forecast based on your knowledge of the deals, without losing track of where you are in your sales process. The forecast tool is helpful to use during one-to-ones with your reps and identify where they need to focus their efforts to make their monthly or quarterly goals.
Before getting started, make sure your user has Forecast permissions assigned. Then, assign revenue goals to your team and set up your forecast categories if you would like to use them. Once set up, you can view revenue reporting for users in your account who have assigned Sales Hub or Service Hub Professional or Enterprise paid seats.
When you deactivate a user but keep their Sales Hub or Service Hub Professional or Enterprise paid seats, their historical sales data will remain in the forecasting tool. This ensures you have a complete and accurate picture of historical sales so you can make informed forecasts for current and future periods.
Please note: if you're a Super Admin, learn how to opt your account into the beta.
Set a currency
Each user in your account can set their preferred currency in the forecast tool. Once set, you can view forecast data and submit manual forecasts in your preferred currency. Keep in mind:
- Currency conversions are done automatically as needed, in accordance with the exchange rates in your account.
- Open deals and goals use the most current exchange rate. Closed won deals use the exchange rates in place when the deal was closed to maintain historical accuracy.
- Manually submitted forecasts maintain the exchange rate at the time of submission.
To set your currency:
- In your HubSpot account, navigate to Reporting & Data > Forecast.
- In the top right, click Set currency.
- Click the Preferred currency dropdown menu and select a currency.
- Click Save.
Submit a forecast
You can submit a custom forecast for the month or quarter to give your stakeholders an estimate of how much you think you'll close during that time. You can submit a forecast within the forecast tool or from the default Forecast view on your deals index page.
To submit from the forecast tool:- In your HubSpot account, navigate to Reporting & Data > Forecast.
- In the Forecast submission column, click the pencil icon next to the user or team you want to submit a custom forecast for.
- In the right panel, select the Pipeline and Forecast period. The time period you select must match your forecast period (e.g. select a specific month if your forecast period is set to monthly).
- Enter an amount (in your company's primary currency) in the Forecast amount field.
- To track the history of forecast submissions, click View history to expand the section.
- To view past forecast submission history, navigate to the History tab. Click the <, > arrows to change the time period. You can view up to one year previous.
- Click View submissions over time to view the history of Forecast submissions in Sales analytics.
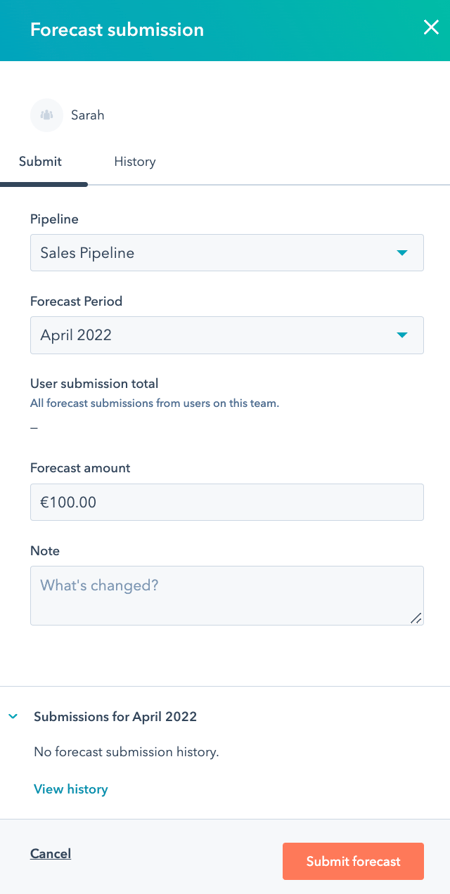
- When you're ready to submit your forecast, click Submit forecast.
- For additional sales analytics reporting, you can use the reports in your sales analytics tools. To access the sales analytics reports, in the top right click Go to Sales Analytics.
You can also navigate to the Forecast tool from the deals index page. For each user with an assigned Sales Hub Professional or Enterprise seat and Forecast permissions, this view displays the user's assigned deals and relevant deal properties.
- In your HubSpot account, navigate to CRM > Deals.
- In the table view, click the Forecast tab. If Forecast is not shown as a tab, click + Add view, then select Forecast from the dropdown menu.
- In the top right, click Go to Forecast.

- You will be redirected to the Forecast tool where you can submit a forecast.
Please note: if you clone the Forecast view, the Go to Forecast functionality will not be available in the cloned view.
Review a forecast on your desktop
- In your HubSpot account, navigate to Reporting & Data > Forecast.
- To review your forecast by deal stage, click the Deal stage tab.
- To review your forecast by category, click the Forecast category tab.
- Use the dropdown menus at the top to filter by pipeline or close date.
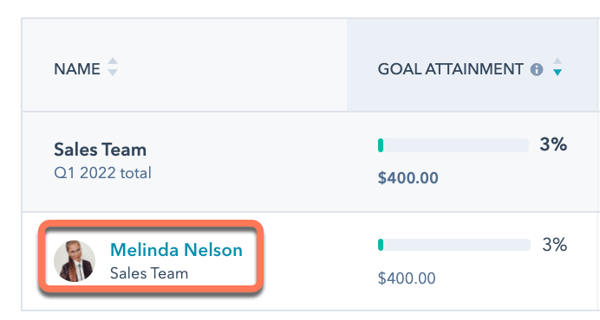
- To review your forecast by team, click the team name.
Please note: if your Forecast view permissions are set to Team only, you will only be able to view your own goals and forecast in the team forecast, not your teammates'.
Users with assigned Sales Hub Professional or Enterprise seats will appear in the forecast tool. In the top left, you can search for a user that's not assigned a team.
In the team table at the top, you can analyze the following for users that are assigned a team:

- Goal: the revenue goal.
- Closed Won: the sum of amounts for all deals with the deal stage set to Closed won.
- Gap: the difference between the goal and deals with the deal stage set to Closed won.
- Forecast Submission: the sum of forecast submissions for your team.
In the pipeline table at the top, you can analyze the following:
- Open pipeline: the sum of amounts for all open deals that you have access to for the selected time period.
- Open pipeline coverage: the open pipeline divided by gap to goal.
-
- Goal attainment: the closed revenue relevant to the user's revenue goal.
- Weighted pipeline or Total pipeline: the amount of all forecasted deals for the time period.
- If your Forecast deal amount settings are set to weighted amount, Weighted pipeline will be displayed.
- If your Forecast deal amount settings are set to Total amount, Total pipeline will be displayed.
- Forecast categories: monitor the forecasted deal amount in each forecast category.
- Forecast submission: an estimate of how much will be closed in a specific time period.
- To drill down into a specific user's forecast, click the user's name.
- Here you can review the deals assigned to the user. You can assess where each deal is in the pipeline and identify which deals need more attention from your sales rep in order to close the deal.
- Use the tabs at the top to filter the deals by deal stage or forecast category. Use dropdown menus at the top to filter by pipeline or close date.
- A green or red dot under a deal stage indicates the stage moved forward or backward within the date range selected in the Close date dropdown if the deal was created before the date range.
- A green or red caret under a weighted deal amount indicates the amount increased or decreased within the date range selected in the Close date dropdown if the deal was created before the date range.
- Use the tabs at the top to filter the deals by deal stage or forecast category. Use dropdown menus at the top to filter by pipeline or close date.

-
- To open the deal record, click the deal name.
- To edit the columns that appear, click Edit columns in the upper right. Select or clear the checkboxes next to the properties to display them, then click Save.
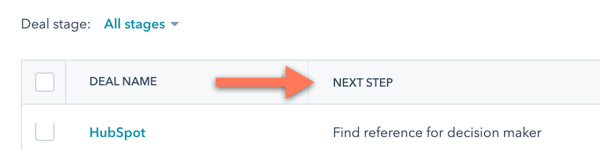
- To enter next steps the user should take to move the deal to the next stage, enter notes in the Next step field. The text that you enter will populate the Next step property on the deal record. Click Save.
- To navigate back to your forecast, click Back to Forecast in the top left.
Review a forecast on the HubSpot mobile app
You can review forecast progress on the HubSpot mobile app.
- Open the HubSpot mobile app.
- Under Forecast Progress, you can view recent forecasts for selected pipelines. To view these forecasts, tap Go to Forecast. You can also access forecasts by tapping Menu in the bottom navigation menu, then selecting Forecast in the left sidebar.
- You can filter your forecast view by selecting the Pipeline or Time period dropdown menus.
- Tap a user or team to view their forecast progress.
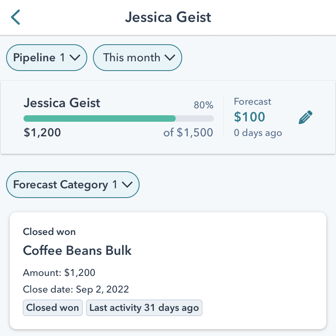
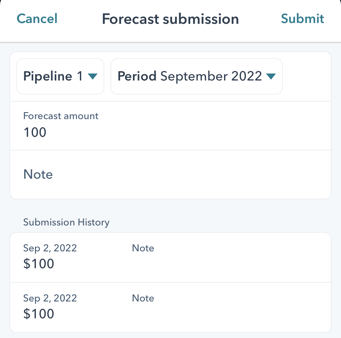
- You can submit a forecast by tapping the pencil icon at the top of the screen.
- Select the Pipeline and Period dropdown menus to select the pipeline and time period of your forecast submission.
- Enter the Forecast amount.
- Enter any notes for the forecast submission.
- View your Submission History.
- Tap Submit.
- View and filter deals associated with the forecast by selecting the Forecast Category dropdown menu and selecting the checkboxes next to the category names you want to filter by.
- To view a deal associated with the forecast, tap the deal name. The deal screen will appear where you can add notes, create tasks, and log activity. Learn how to create and navigate deals on the HubSpot mobile app.