Last updated: April 23, 2024
Available with any of the following subscriptions, except where noted:
|
|
View the performance of a single HubSpot campaign to measure its impact on contacts, deals, and traffic to your website. Learn more about the different campaign metrics available and how to analyze overall campaign performance.
Before you get started
When reviewing your campaign's performance, please note the following:
- Campaign analytics, such as the metrics in the Overview report, are based on the assets associated with the campaign:
- Asset data for these reports are only included after association. These metrics are calculated from the date and time the assets were associated with the campaign.
- Asset data from prior to the association will not be included in these metrics.
- The metrics in the [name of asset] section reports will show historical data for each individual asset. These metrics are not dependent on the date and time an asset was associated with the campaign and will include data from prior to the association.
Analyze campaign performance
To analyze a campaign's performance, begin by navigating to the campaign you want to view:
- In your HubSpot account, navigate to Marketing > Campaigns.
- Click the name of the campaign.
- In the upper left, you can filter your campaign data:
- Contact attribution: select if new contacts should be attributed to the campaign via First touch or Last touch.
- Date range: click the Date range dropdown menu to filter the data to a specific time range.
Below are the reports displayed in the campaign's Perfomance tab. Each report presents different engagement data, split out by network. Learn more about the requirements of different campaign metrics. To display a report in the table below, hover over the report icon.
| Report Name | Metrics | How to use the report |
Overview
|
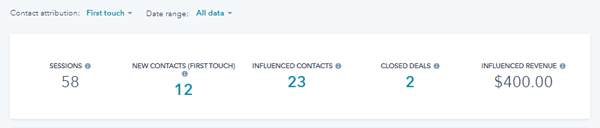
This report displays the following metrics:
|
The Overview report displays an overview of the campaign's performance, any campaign goals will appear under the respective performance metric. In the report, click the following number of the following metrics for more detail:
|
Revenue (Marketing Hub Professional only)
|
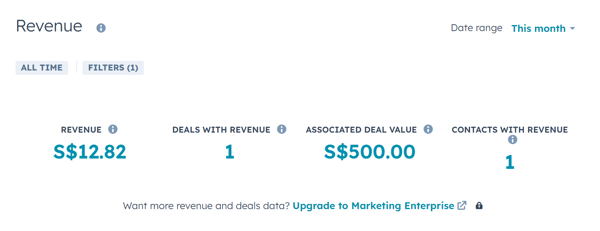
This report uses the following metrics. These metrics are only available in accounts with Marketing Hub Professional only:
|
The Revenue report displays an overview of the campaign's revenue attribution.
|
Revenue Attribution (Marketing Hub Enterprise only)
|
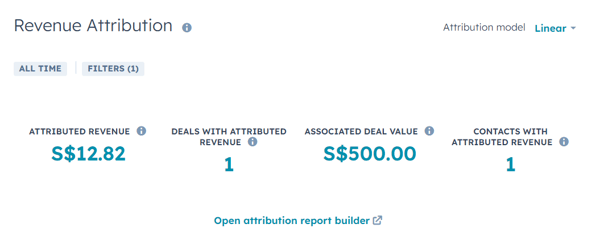
This report uses the following metrics:
|
The Revenue Attribution report displays an overview of the campaign's revenue attribution.
When analyzing your revenue attribution report, do note that:
|
Contacts and Sessions
|
This report uses the following metrics:
|
This report shows a chart of the contacts or sessions attributed to the campaign. Hover over a data point in the report to view a breakdown of metrics.
|
Asset reports
|
The metrics in each report vary depending on the asset or content type associated with the campaign. |
This section displays the performance of each asset or content type associated with the campaign.
|
Traffic
|
This report uses the following metrics:
|
This report displays traffic to URLs containing the UTM campaign parameter in terms of views, visitors, and new contacts, broken down by source.
From this report, you can also review your tracking URLs and create new ones:
|
Export your campaign performance details
Share your campaign performance data externally by exporting the selected campaign's performance details.
After exporting your campaign performance details, the exported file will be sent to your default user email and will appear in the notification center. To receive this file, you must turn on your user notifications.
- In your HubSpot account, navigate to Marketing > Campaigns.
- Click the name of the campaign.
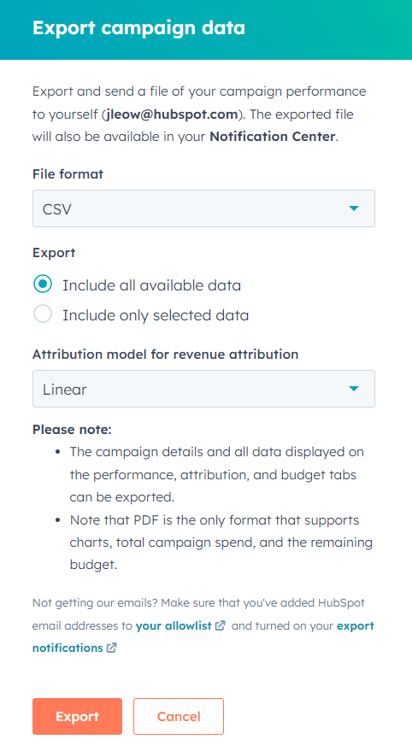
- At the top, click Actions and select Export.
- File format: choose to export the data in a csv, xls, xlsx, or an image PDF format.
- Export: choose to export all available campaign performance data or only specified data.
- Include all available data: export all available campaign performance data for the campaign.
- Include only selected data: export only specified campaign performance data. In the Export options section, select the checkboxes next to the data type that you want to export.
- Attribution model for revenue attribution: if you have a Marketing Hub Enterprise. subscription, select the attribution model for the revenue attribution report.
- After configuring your export, click Export.
Analyze campaign attribution
In each campaign, you can review the new contacts, deals, and deal revenue generated by the campaign's assets.
- In your HubSpot account, navigate to Marketing > Campaigns.
- Click the name of the campaign.
- At the top, click the Attribution tab.
- To configure your report dates, at the top of page, use the date picker to select a date range or set specific dates. When filtering your campaign attribution by date, do note the following:
- New contacts and deals are measured by the date of creation, not of the interaction. Similarly, filtering a revenue report by date will include deals that have been closed within the date range.
- By default, reports are filtered by All data, which includes all data up to the current date. To include future dates in a report, manually set the date range to include those dates.
- To select your attribution model, at the top of page, click the Attribution model dropdown menu and select an attribution model.
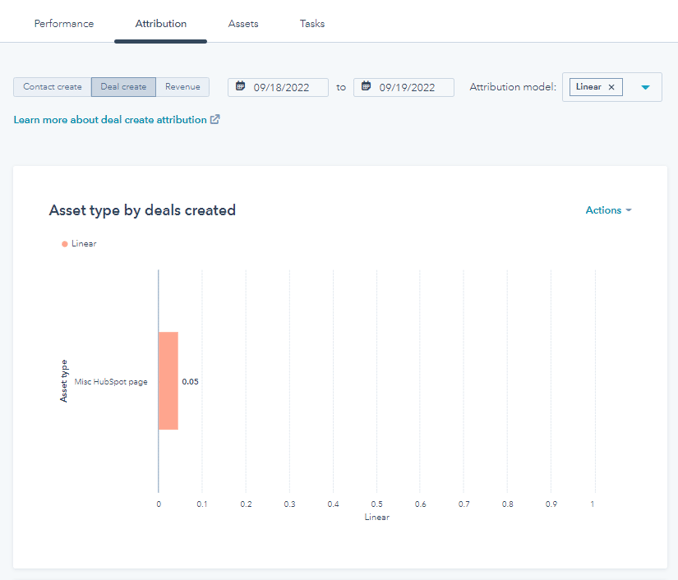
- To select your attribution data, in the top left, select Contact create, Deal create, or Revenue.
- Contact create: measure how effective the campaign’s assets are at generating new contacts. When a visitor interacts with a campaign asset and is later created as a contact, the interaction will receive credit for the contact being created. Learn more about building contact create attribution reports.
- Deal create: measure how effective the campaign’s assets are at generating new deals. When a contact interacts with a campaign asset and a deal is created and associated with the contact, the interaction will be attributed to the deal being created. Learn more about building deal create attribution reports. If a deal is not appearing in the report, review the requirements for deal data to appear in a campaign.
- Revenue: measure how effective the campaign’s assets are at generating revenue from closed deals. When a contact interacts with a campaign asset and a deal that’s associated with the contact is closed, the interaction will be attributed for generating the deal’s revenue. Learn more about building revenue attribution reports.