- Knowledge Base
- Reporting & Data
- Reports
- Create custom single object reports
Create custom single object reports
Last updated: November 19, 2025
Available with any of the following subscriptions, except where noted:
-
Marketing Hub Professional, Enterprise
-
Sales Hub Professional, Enterprise
-
Service Hub Professional, Enterprise
-
Data Hub Professional, Enterprise
-
Commerce Hub Professional, Enterprise
With a single object report, you can analyze an object, such as contacts, in relation to its object properties. For example, use a single object report to view a breakdown of contacts by lifecycle stage and annual revenue.
Single object reports can be built for the following objects:
- Calls
- Carts
- Contacts
- Companies
- Conversations
- Custom objects (Enterprise only)
- Deals
- Engagements
- Goals
- Invoices
- Tickets
- Leads
- Line items
- Meetings
- Orders
- Payments
- Quotes
- Sequences enrollment
- Subscriptions
- Survey responses
- Tasks
- Users
Please note: the number of custom reports you can create depends on your subscription. Learn more about reporting subscription limits in the HubSpot Product & Services Catalog.
Create a report
You can create a report from a template, organized by business area and data type, or from scratch.
Template report library
HubSpot’s report templates make it easy to track key metrics without starting from scratch. Browse a curated library of standard reports covering everything from website performance to sales insights.
- In your HubSpot account, navigate to Reporting > Reports.
- Click Create report at the top right.
- In the left sidebar menu, select Template report library.
- Click Next.
- Use the search bar to find templates using the object keyword such as Contacts.
- Filter displayed templates by clicking the Data Sources and Visualization dropdown menus.
- Select the template you want to use.
- In the dialog box, review the report. If you would like to customize the report visualization further, click Customize. Learn more about configuring the report.
- Once done, click Save report.
AI-generated report
Use Breeze AI to generate single object reports using new and existing prompts.
- In your HubSpot account, navigate to Reporting > Reports.
- Click Create report at the top right.
- In the left sidebar menu, select AI-generated report.
- In the Describe your report textbox, type details such as objects, filters, or timelines you want included in your Attribution report. For example: "Which contacts were created by content title?"
- Alternatively, in the Try using an existing prompt section, you can select a prompt card to paste into the textbox above.
- Click Generate report.
- Review the report. If you would like to customize the report visualization further, click Customize. Learn more about configuring the report.
- Once done, click Save report.
Single object report custom builder
The Attribution custom report builder offers flexibility and customization. You can analyze multiple data sources or datasets across HubSpot, including object and event data.
- In your HubSpot account, navigate to Reporting > Reports.
- Click Create report at the top right.
- In the left sidebar menu, click Single-object report.
- Click Next.
- Under What data source do you want to report on?, select a data source.
- Click Next.
- Learn more about configuring the report below.
Configure the report
In the left sidebar, configure the report in any of the following ways:
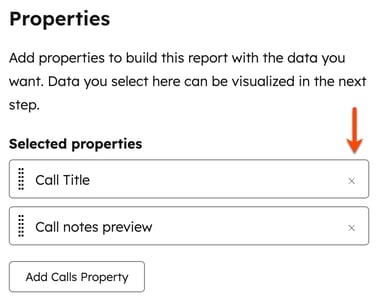
- In the left sidebar, click Add [object type] Property to browse and select the properties you want to report on.
- After selecting these properties, in the left panel, drag and drop properties to reorder the columns in the table on the right.
- To remove a property, click the x next to its name.

- At the top of the page, add filters for date property and date range, as well as more advanced filters.

- Click the Visualization tab to customize the appearance of your report.
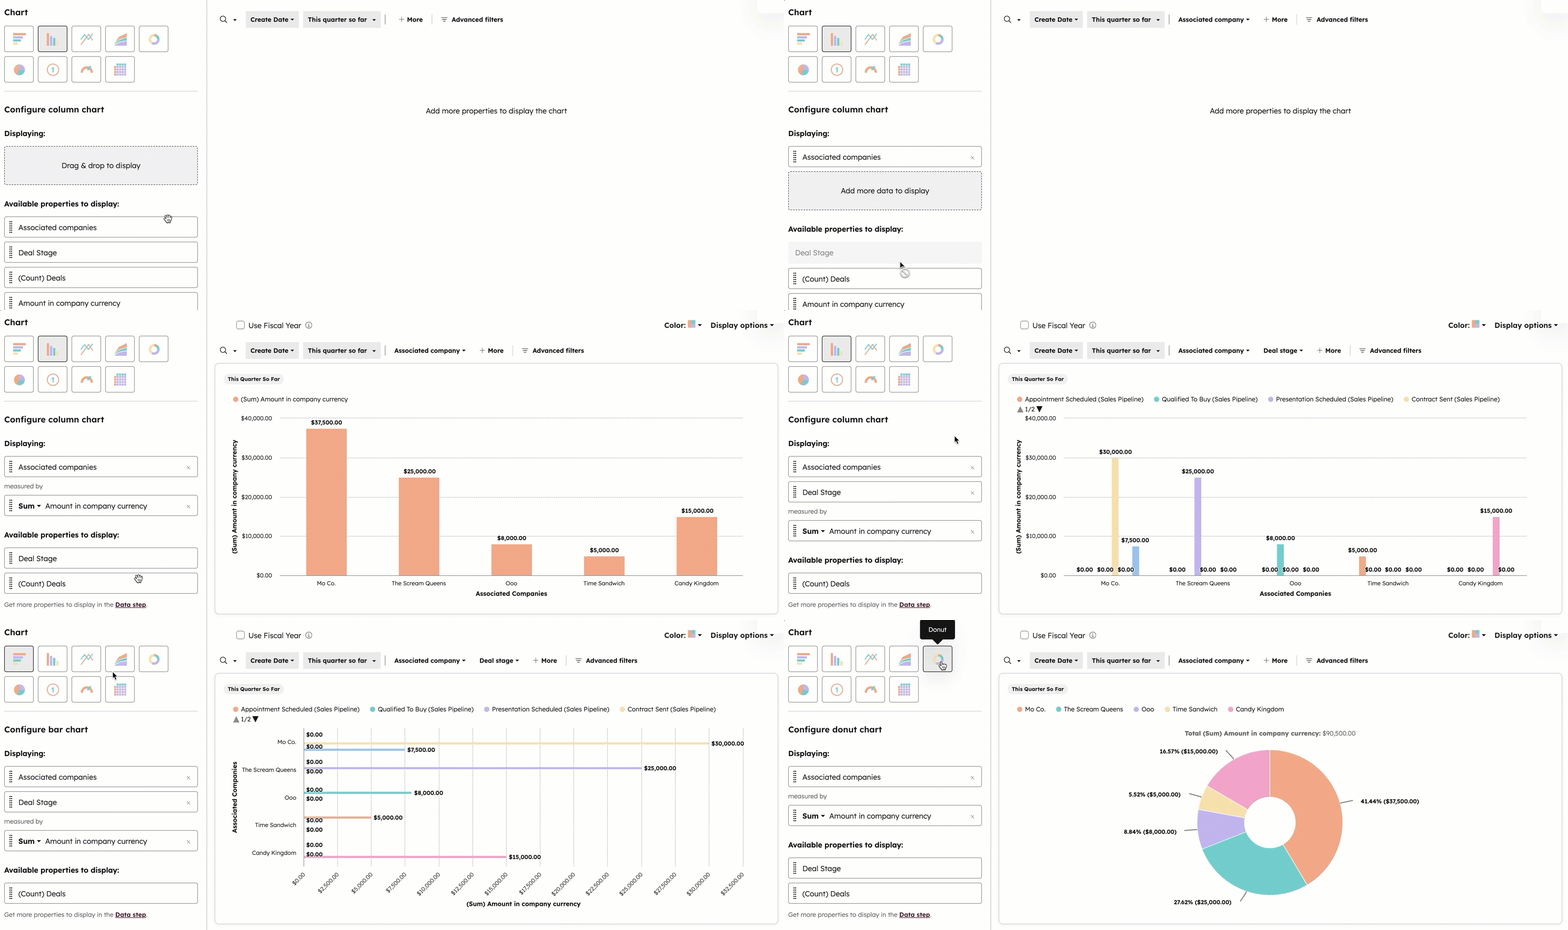
- In the left panel, select a chart type. The available options depend on the object type you've selected.
Please note: for the summarized table chart type, there's a limit of 500 results in single object reports.
-
- In the Configure chart section, drag and drop properties into the Displaying section to add them to your chart. You must select a date property or a property that gives a specific count to plot your data.

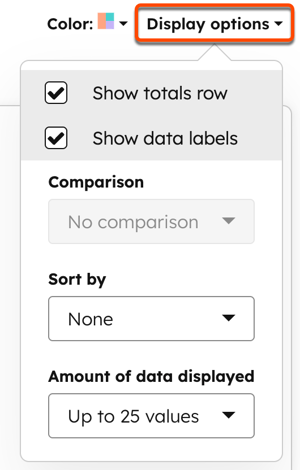
- If you've selected a line or area chart with a date property as a report measure, you can compare the current data set with a goal or a previous time period. In the upper right, click the Display options dropdown menu.
- To compare your data with a static number goal for each month, select Include monthly report goal and enter the monthly goal in the Goal field.
- To compare your data with existing set goals related to the data in your report, select Include [measurement] goal.
- To compare your data with a previous time period, click the Comparison dropdown menu and select the date range you'd like to compare the current data to. The options displayed here depend on date property filters you've set.
Please note: to report on Goals in your HubSpot account, the user creating the report must have a seat

-
- If you are reporting on deals, have multiple currencies in your account, and have selected the Amount in company currency property, the Closed amount in company currency property, or the Forecast amount in company currency property, amounts will appear in the company currency by default. Click the Currency dropdown menu to convert amounts to another one of your currencies.
-
- To receive a file with your report's data, click Export in the upper right. In the dialog box, select the File type, and click Export.
Please note: the export will only include the properties that have been added to the Selected properties section of the Data tab.
-
- When you're done with your report, click Save report to add it to your list of saved reports.
Manage single object reports
After creating your single object report, view an overview of the report.
- In your HubSpot account, navigate to Reporting > Reports.
- Click the name of a single object report.
- At the bottom of the report viewer:
- On the Summarized data tab, view a summary of the high-level KPIs on the report.
- On the Unsummarized dataset tab, view the unaggregated data in your report.
