Last updated: January 29, 2024
Available with any of the following subscriptions, except where noted:
|
|
|
|
| Legacy Marketing Hub Basic |
Use HubSpot's traffic analytics tool to view website traffic data. This includes viewing traffic by source, topic cluster, device type, country, and more.
If you have an external site, ensure you install the tracking code to your site to begin tracking your traffic in HubSpot.
To navigate to the traffic analytics tool:
- In your HubSpot account, navigate to Reporting & Data > Reports. Then, select Traffic.
- By default, you'll be brought to the Sources tab of the traffic analytics tool.
Using reports in the traffic analytics tool
Below, learn how to customize, filter, export, and save traffic analytics report data.
Please note: when viewing traffic analytics reports, it's expected that past report data may change over time, as HubSpot will reprocess analytics data if it's able to gather more accurate data. For example, you may see data change if HubSpot is able to merge sessions or if contacts' original sources are updated.
Customize and filter report data
While on any of the tabs in the traffic analytics tool, you can change the report's date range and frequency, export and save the report, and filter data by specific analytics views. Any filtering you add, such as date range, will apply to both the chart visualization and the raw data table.
- To filter the data by time range and frequency, use the Date range and Frequency dropdown menus.
- These filters apply across all tabs of the traffic analytics tool.
- If you select a rolling date range, the data set will exclude the current day.
- A week in the report starts on Sunday by default, when the date range selected consists of a week, or when the frequency is set to Weekly.
Please note: when using a date filter, reports will only display traffic data that occurred during the selected time frame. For example, a page that has not had any visits in the past month will not appear in the pages report when filtering for Last month.

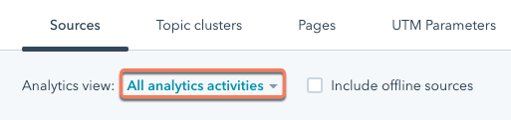
- To filter the data to only show traffic for a specific analytics view, click the Analytics view dropdown menu, then select an analytics view, or click Manage views to customize your analytics views. This option is not available for the Topic clusters tab.
- To customize the metrics that appear in the table below a chart:
- In the upper right of the table, click Edit columns.
- In the dialog box, select the checkbox for each metric you want to display. You can only have a maximum of seven metrics at a time in your table. Learn more about the metrics below.
- Click the X next to a property in the Selected columns section to remove it from the table.
- Click Save to apply these changes.
Export or save a report
- To export a report as a CSV, XLS, or XLSX file:
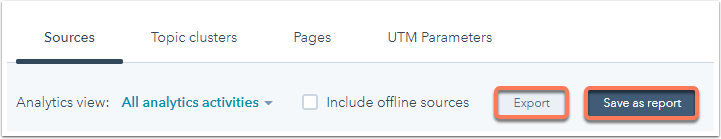
- Above the chart, click Export.
- In the dialog box, enter the Name of your file and click the File format dropdown menu to select a format. Click Export.
- The export file will be sent to your email address and can be downloaded in your notification center, accessed by clicking the icon in the top right.
- To save a report to a dashboard or your report library:
- Above the chart, click Save report.
- In the dialog box, enter the Report name.
- To add the report to a dashboard, click the Add to dashboard dropdown menu and select if you want to add it to an existing dashboard or create a new custom dashboard.
- If you select Existing dashboard, click the Select existing dashboard dropdown menu and select the dashboard to add the report to.
- If you select New custom dashboard, enter the Custom dashboard name and click the Visibility dropdown menu to select if the dashboard should be shared, shared but read only to others, or private to your own user.
- Click Save & add.
Types of traffic analytics data
Below, learn about the types of data on each tab of the traffic analytics tool.
Sources
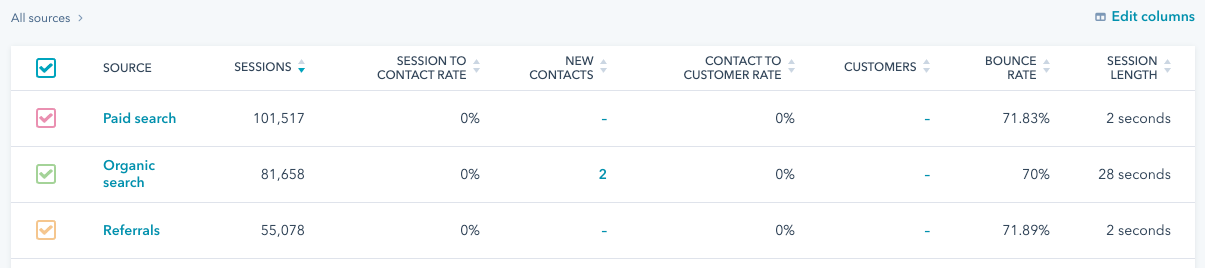
The Sources tab shows where on the internet your visitors are coming from. Learn more about the sources defined by HubSpot.
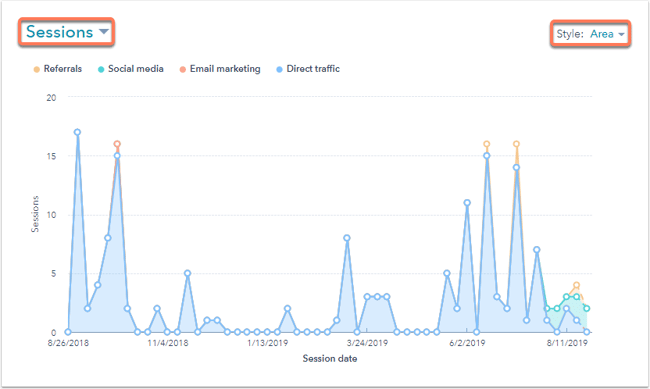
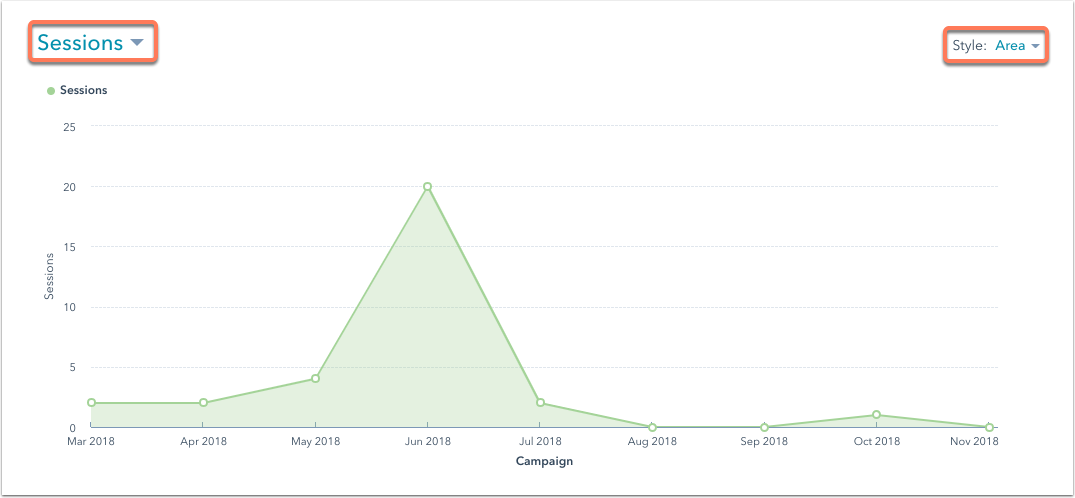
By default, the chart will display total sessions by source as a line chart.
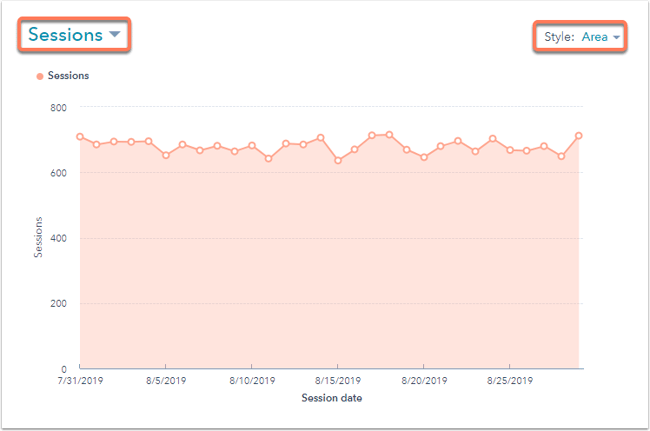
- To display a different metric, in the upper left of the chart, click the dropdown menu and select the metric you want to view in the chart. Learn more about these metrics below.
- To change the chart visualization style, in the upper right of the chart, click the Style dropdown menu and select the type of chart you want to use. You can choose an area chart, column chart, line chart, or a combination of an area and line chart to visualize the data.
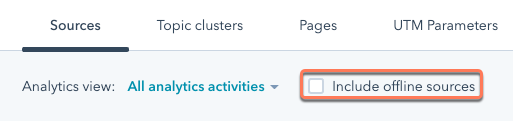
- To include contacts that were added through offline means, such as through an import, select the Include offline sources checkbox.
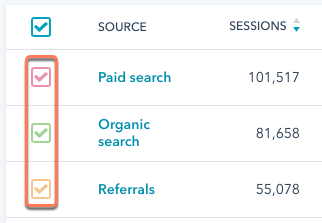
- To view a specific source's data in the chart, select the checkbox next to it in the table below. You can select multiple sources to compare their impact.
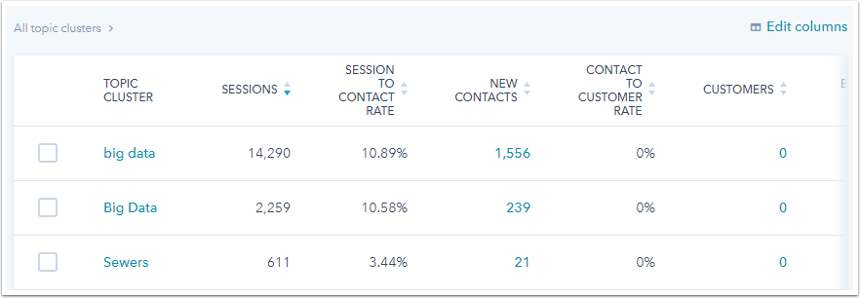
Topic clusters
The Topic clusters tab shows you the traffic data in terms of the topic clusters you've created.
- By default, the chart will display total topic cluster sessions as a line chart. To update the displayed metric and chart type, in the upper left of the chart, click the dropdown menu and select the metric you want to view in the chart. Learn more about these metrics below.
- To view only a specific topic's data in the chart, select the checkbox next to it in the table below. You can select multiple topics to compare their impact.
- To drill down further into a topic's data, click the topic name, then click a subtopic name to view data for individual pages associated with that topic.
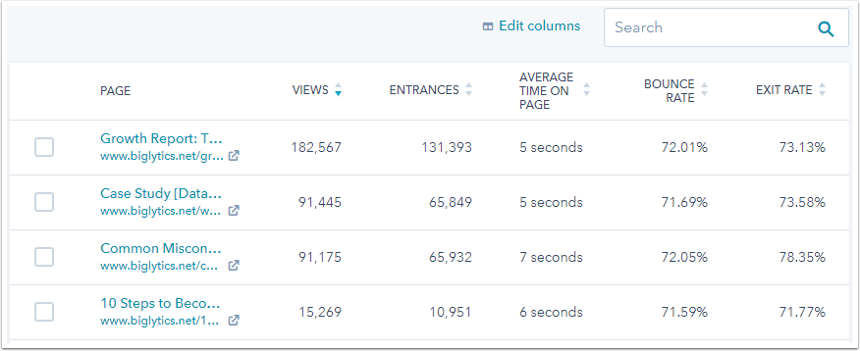
Pages
The Pages tab shows your content's performance using key traffic metrics. By default, you'll see data for all of your HubSpot pages. The New contacts metric in this report includes all contacts created from form submissions.
Please note:
- The Pages report shows historical data for every URL that has ever been crawled or received a view. If a page is removed or redirected, it will still remain in the traffic data to maintain the integrity of the analytics data. Pages cannot be removed from this report.
- The Pages report will track up to 20,000 unique external page URLs per month. Once that limit is exceeded, the report will then track a limit of 100 new unique external page URLs per day. Page views to external URLs beyond that limit will be bucketed under their domain rather than full page URL. Learn more about this limit below.
- When a visitor accesses a file, whether as a download or a URL, it will not count toward any page view metrics.
The Pages report can be further filtered by page type:
- To filter your data based on page type:
- Click the Page types dropdown menu above the chart.
- Select Blog posts, Landing pages, Website pages, or Knowledge articles to filter the data to that specific page type.
- To further filter your content, click Filter [page type] to filter pages by different metrics.
- If you've selected Blog posts, you can filter the metrics by blog, blog author, language, and blog tag.
- For any other page type, you can filter the metrics by domain and language. Only primary domains can be filtered. If you want to filter by another domain, you may want to create a custom analytics view.
- When you've installed your HubSpot tracking code on pages that are hosted on external domains, views to those pages will not be categorized in the page types available here unless you add additional code. Learn about the additional code that you can add to your external pages for categorization.
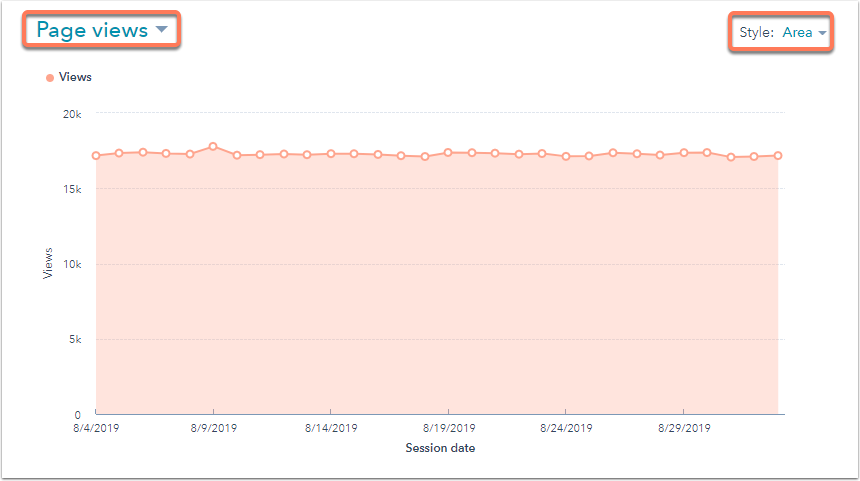
By default, the chart will display total page views as a line chart. To update the displayed metric and chart style:
- In the upper left of the chart, click the dropdown menu and select the metric you want to view in the chart. By default, Page views will be selected. Learn more about these metrics below.
- In the upper right of the chart, click the Style dropdown menu and select the type of chart you want to use for analysis. You can select an area chart, a column chart, a line chart, or a combination of an area and line chart to visualize the data.
- To include a specific page in the chart, select the checkbox next to a page in the table below the chart.
- Enter search terms in the search bar to search for a specific page. You can enter text in quotation marks (e.g. "Homepage - Version 2") to search a specific term. This will only work with HubSpot-hosted pages.
- Click a column header to sort the pages by that metric.
- In the table below, select the checkbox next to a page to include it in the chart. Select multiple pages to compare their impact.
- Click a page to view its details in a new tab.
Other pages on domain
If you're tracking an external site that generates over 20,000 new, unique URLs per month, review the limits below to understand how HubSpot will bucket your external page views.
For performance reasons, the Pages report will only display page views per URL for up to 20,000 external pages per month. Once 20,000 new, unique external page URLs have been added to the report in a given month, the report will then display page views per page URL for up to 100 new unique page URLs per day. Any page views beyond this limit will be bucketed under the domain rather than the page URL. In the report, you'll see these views categorized as Other pages on domain.
- This limit only applies to URLs that the account has never previously tracked views for.
- Pages hosted on HubSpot do not count against this limit.
For example, your website might be structured to create a new page per user, such as www.example.com/user/michaelscott. If you're tracking all of these external pages in HubSpot, the Pages report will display those page views as follows:
- If in August you receive 15,000 sign ups, meaning that 15,000 new user pages are created at unique URLs, the Pages report will display page views for each unique URL.
- If in September you receive 25,000 new sign ups, meaning 25,000 new user pages are created at unique URLs, the Pages report will display page views per unique URL for the first 20,000 pages. Since you've hit the monthly limit, the Pages report will continue to display page views per unique URL only for the first 100 new pages per day. All views for new, unique page URLs after that will be bucketed under the domain rather than individual pages. For the rest of the month, views for new pages beyond the first 100 per day will appear under Other pages on domain www.example.com.
For websites that would exceed these limits, there are a couple options to avoid views being bucketed under Other pages on domain:
- Set a canonical URL in the affected pages' HTML headers, such as https://example.com/user. This will instruct HubSpot to track page views under one URL. Learn more about canonical URLs.
- For single-page applications, customize your HubSpot tracking code using the
setPathfunction. Similar to the above, this will instruct HubSpot to track page views under the specified URL rather than each new, unique URL.
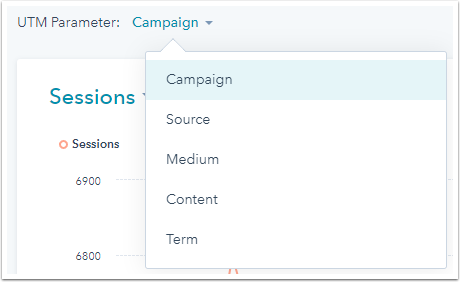
UTM parameters
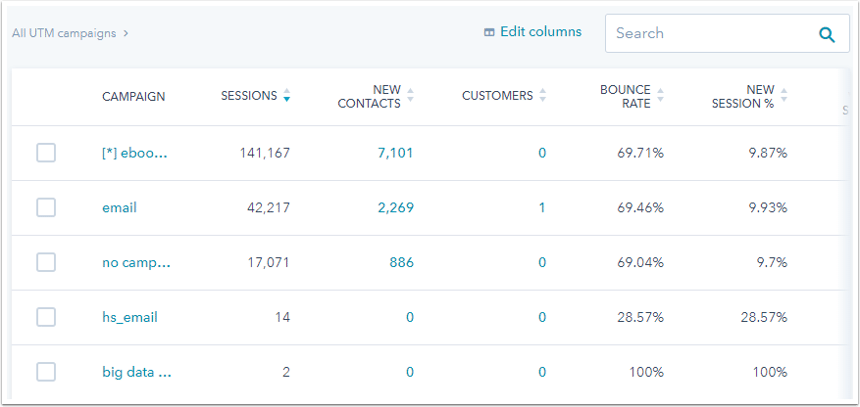
The UTM Parameters tab allows you to analyze traffic data in terms of the UTM parameters in the URLs that your visitors are using to access your site. This includes analyzing any manual tracking URLs you've created.
- To analyze a specific UTM parameter, click the UTM Parameter dropdown menu in the upper left and select the type of parameter. By default, Campaign will be selected.
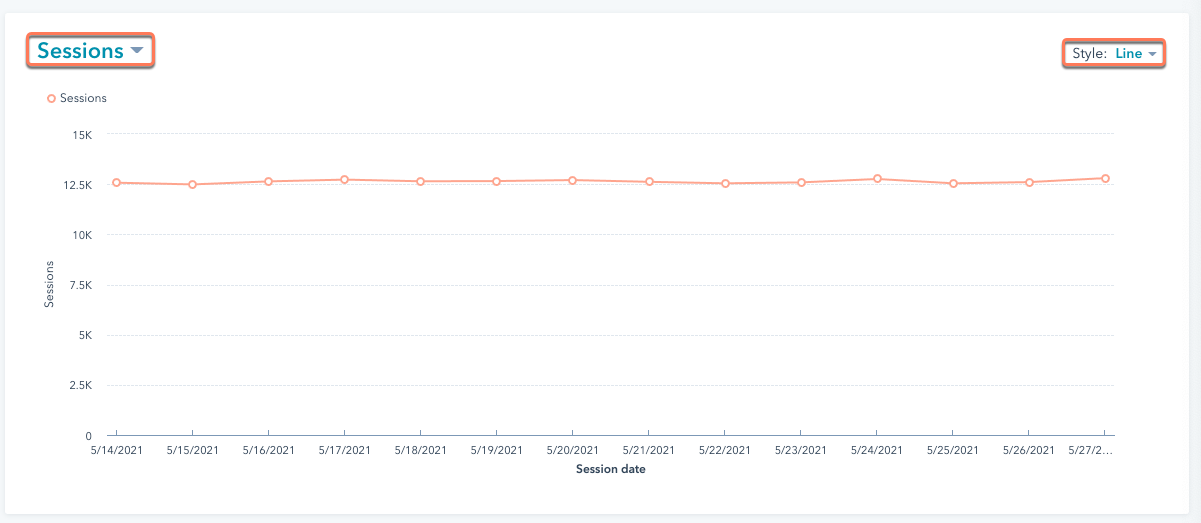
By default, the chart will display total UTM parameter sessions as a line chart. To update the displayed metric and chart style:
- In the upper left of the chart, click the dropdown menu and select the metric you want to view in the chart. By default, Page views will be selected. Learn more about these metrics below.
- In the upper right of the chart, click the Style dropdown menu and select the type of chart you want to use for analysis. You can select an area chart, a column chart, a line chart, or a combination of an area and line chart to visualize the data.
- In the table below, select the checkbox next to a page to include it in the chart.
Below the chart, the table displays the raw UTM parameter metrics.
- Enter search terms in the search bar to search for a specific UTM parameter.
- Click a column header to sort the UTM parameters by that metric.
- Click a UTM parameter to view the specific source where the visitor came from with the UTM parameter.
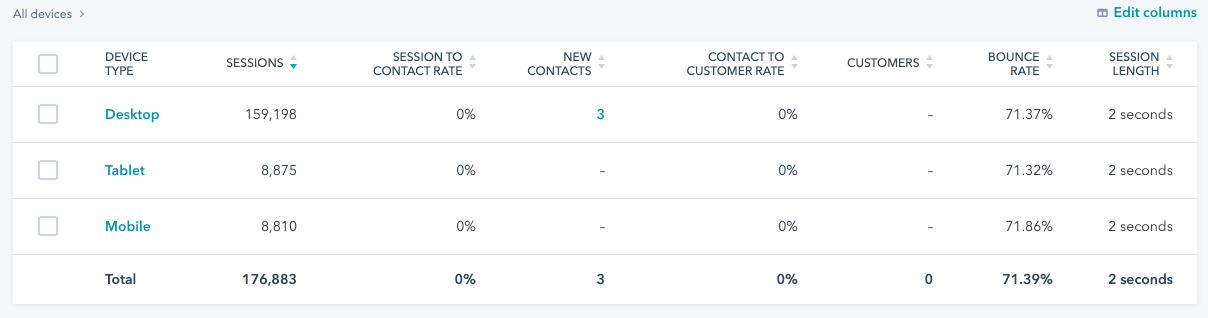
Device types
The Device types tab enables you to analyze your site traffic by visits made on desktop, tablet, and mobile.
By default, the chart will display total sessions as a line chart.
- To display a different metric, in the upper left of the chart, click Sessions and select the metric you want to view in the chart. Learn more about these metrics below.
- To change the chart visualization style, in the upper right of the chart, click the Style dropdown menu and select the type of chart you want to use. You can choose an area chart, column chart, line chart, or a combination of an area and line chart to visualize the data.
- To include specific device types in the chart, select the checkbox next to the device type in the table below the chart.
The table below the chart displays the raw data of your website traffic by device type.
- Click a column header to sort the pages by that metric.
- Select the checkbox next to a device type to include it in the chart.
- Click the name of a device type to view data by device operating system.
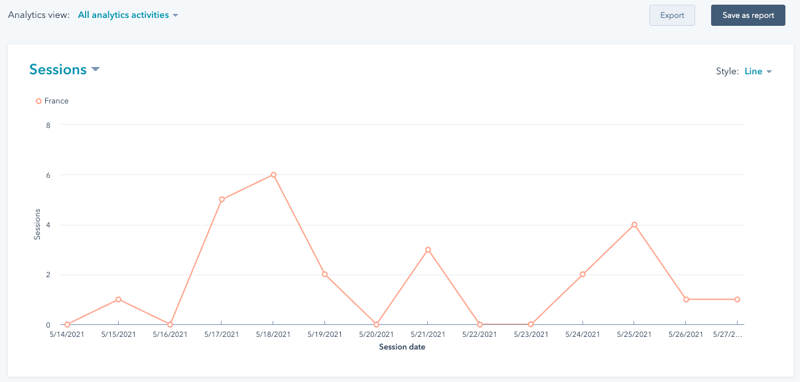
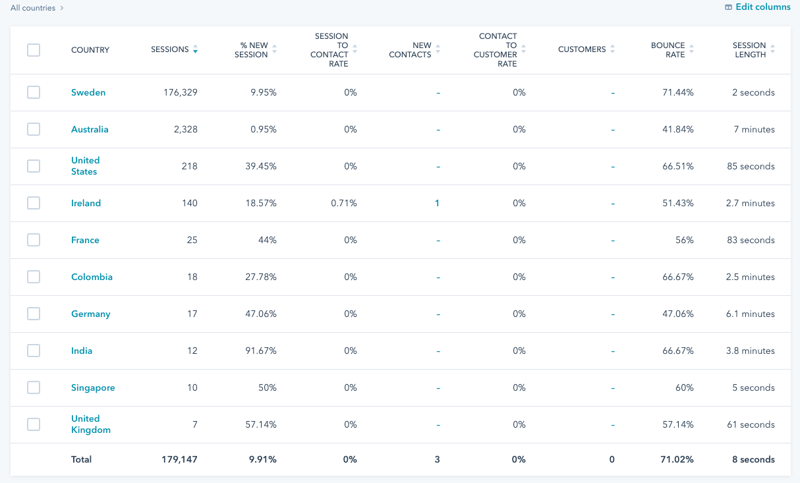
Countries
On the Countries tab, analyze your site traffic by the countries of your visitors. HubSpot's country code data uses the ISO 3166 standard.
By default, the chart will display total sessions by country as a line chart. To update the displayed metric and chart style:
- In the upper left of the chart, click the dropdown menu and select the metric you want to view in the chart. By default, Page views will be selected. Learn more about these metrics below.
- In the upper right of the chart, click the Style dropdown menu and select the type of chart you want to use for analysis. You can select an area chart, a column chart, a line chart, or a combination of an area and line chart to visualize the data.
- To include specific countries in the chart, select the checkbox next to the country in the table below the chart.
The table below the chart displays raw traffic data by country.
- Click a column header to sort the pages by that metric.
- Select the checkbox next to a country to include it in the chart.
- Click the name of a country to view more specific location data. If HubSpot isn't able to determine the specific location, you may see Unknown for the location or region.
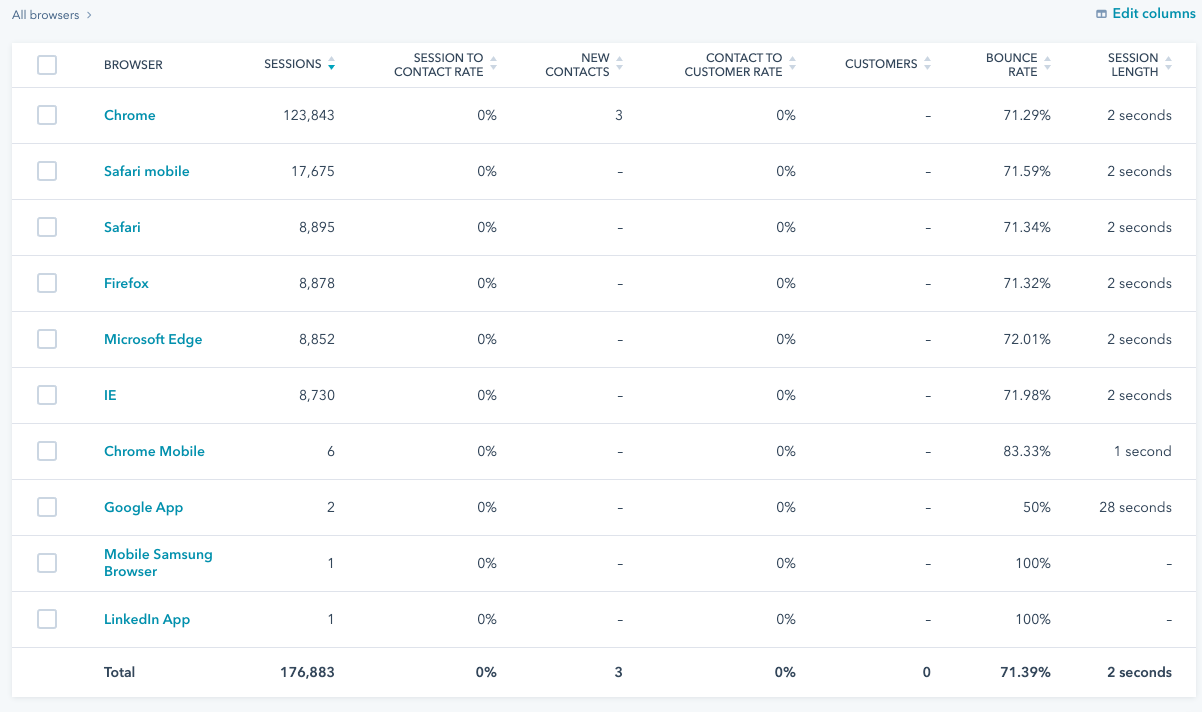
Browsers
The Browsers tab enables you to analyze your site traffic by browser.
By default, the chart will display total sessions by browser as a line chart. To update the displayed metric and chart style:
- In the upper left of the chart, click the dropdown menu and select the metric you want to view in the chart. By default, Page views will be selected. Learn more about these metrics below.
- In the upper right of the chart, click the Style dropdown menu and select the type of chart you want to use for analysis. You can select an area chart, a column chart, a line chart, or a combination of an area and line chart to visualize the data.
- In the table below, select the checkboxc checkbox next to a browser to include it in the chart.
- Click a column header to sort the pages by that metric.
- Select the checkbox next to a browser to include it in the chart.
- Click the name of a browser to view browser version data.
Metrics
Below are definitions for the metrics found within the tabs of the traffic analytics tool.
Sources, Topic clusters, UTM Parameters, Device types, Countries, and Browsers
- Sessions: a series of analytics activities taken by a visitor to your website.
- Sessions are not only page views, but include activities such as events, form submissions, and CTA clicks.
- Sessions expire after 30 minutes of visitor inactivity.
- New sessions begin when a visitor returns to the site after 30 minutes of activity or with a new session campaign (e.g., the visitor returns to the site from a different traffic source).
- If a visitor prevents cookie tracking by using an extension or opting out of your cookie policy, and then submits a form, HubSpot will attempt to infer the context of the submission to more accurately record its source, usually through UTM parameters.
- Example scenarios of a session:
- Scenario 1
- A visitor finds your site through organic search.
- They leave and only return to their computer after two hours. They continue to explore your site that was open in their browser and clicks a CTA.
- The first session expired during the two hours of inactivity and a second session was logged with a new source of direct traffic.
- This counts as 2 sessions, each with a different source. The first is organic search, and the second will be direct traffic.
- Scenario 2
- A visitor has an ad blocker installed in their browser to block cookies. HubSpot will be unable to track their page views.
- They access a landing page through a marketing email and submit a form.
- Through UTM parameters, HubSpot is able to attribute this to the email source.
- Scenario 3
- A visitor finds a site via organic search, then leaves the website.
- Within 30 minutes, the visitor goes directly back to the website.
- This is counted as 1 session as the visitor returned within 30 minutes. The source is organic search.
- Scenario 1
- Session to contact rate: the number of form submissions divided by the number of unique visitors for the selected time period.
- New contacts: the number of new contacts created during the selected time period. The Pages report will only count contacts that are created from form submissions, while the Sources report includes contacts from all sources.
- Contact to customer rate: the percentage of new contacts created in the selected time period that eventually became customers.
- Customers: the number of customers who originally created during this time period and are currently in the lifecycle stage of Customer.
- Bounce rate: the percentage of visitors to a particular website who navigate away from the site after viewing only one page.
- New visitor sessions: the number of new unique visitors on your website.
-
A visitor is someone who visits your site, tracked by the cookie placed in their browser by the HubSpot tracking code installed on your site.
-
A single visitor can have multiple sessions and page views to your site.
-
- New session %: the percentage of sessions that are from new users.
- Page views / session: the a
- Avg. session length: the average duration of a visitor's website session.
Pages
- Page views: the number of page views recorded in the designated time period. HubSpot counts a page view every time the HubSpot tracking code is loaded on a browser. Example scenarios of page views:
- Scenario 1
- A visitor searches Google and accesses your site at www.website.com.
- This will count as one page view for www.website.com.
- Scenario 2
- A visitor goes to your X account and clicks a link to your blog at blog.website.com.
- In your blog, they click a link in the menu to view your main site at www.website.com.
- This will count as two page views, one page view bucketed under blog.website.com and one page view for www.hubspot.com.
- Scenario 1
- Submissions: the number of submissions on a HubSpot form or meetings widget on your HubSpot page or blog post. This data does not include meeting modules added through an embed link on an external page.
- New contacts: the number of new contacts created during the selected date range.
- Customers: the number of customers whose first conversion occurred during the selected date range.
- Page view to submission rate: the number of submissions, as defined above, divided by the number of sessions for the selected date range.
- Page view to contact rate: the number of form submissions divided by the number of unique visitors for the selected time period.
- Page view to customer rate: the number of visitors who are currently in the lifecycle stage of Customer divided by the number of sessions for the selected time period.
- Entrances: the number of sessions on your website that started on this page.
- Exits: the number of visitors who ended their session on your website after viewing this page.
- Average time on page: the average time between the start and end of a page view.
- Bounce rate: the percentage of visitors to a particular website who navigate away from the site after viewing only one page.
- Exit rate: the percent of views on this page that were the last in a visitor's session on your site.
- CTA views: the number of CTA views on this page.
- CTA clicks: the number of clicks on a CTA on this page.
- AMP views (blog posts only): a breakdown of how many times the AMP version of your blog post was viewed compared to the number of times it was viewed on a desktop.
- CTA rate: the conversion rate of how many visitors clicked on a CTA they viewed on this page.
- Content type: the classification of the content. For example, knowledge article or blog post. The content type will only populate if the page's domain is connected to your HubSpot account.