- Knowledge Base
- Marketing
- Social
- Analyze social reports
Analyze social reports
Last updated: December 9, 2025
Available with any of the following subscriptions, except where noted:
-
Marketing Hub Professional, Enterprise
After you’ve connected your social accounts, you can view and analyze the performance of your social posts, and track how your social media efforts are performing. You can also monitor the performance of your social posts while on the go with HubSpot's mobile app.
If you're trying to set up your social roundup and summary emails, learn more about managing your social email notifications instead.
Before you get started
Before analyzing your published social reports, take note of the available social report data and its limitations.
Understand requirements
When you connect your social account, the data available for social reporting depends on the social network. Learn more about your social account settings.
- Facebook, Instagram, LinkedIn, and YouTube: posts published either from HubSpot or from the external social network will be available for reporting.
- X: when you connect your account, you can choose whether you want to report on all post data, or only posts you publish from HubSpot. If you want to change your post visibility settings for X, you'll need to disconnect your social account, then reconnect it with the desired setting.
Understand limitations and considerations
- When you connect your social account, the last 60 days of social post data will be pulled in automatically.
- Data from externally published posts can take up to one day to appear in social reports.
- Social reports can only display data from the past year. Data older than one year may not display on your social reports.
- While it isn't possible to publish Instagram IGTV videos from HubSpot, analytics such as likes and impressions from externally published videos will still display. These analytics will also be reflected in relevant social reports.
- HubSpot collects post-specific data for the first 30 days after a post is published. Any data after the 30-day period will not appear in HubSpot. This includes:
- Impressions
- Likes
- Reactions
- Replies
- Retweets
- Shares
- Social reports do not include data from:
- Facebook Reels. Data from Facebook Reels will not be included in social reports, such as the Published Posts report.
- Boosted posts or social ad campaigns. These reports will only include organic social data. If an existing social post is boosted or used for an ad campaign, new data from the post will not be included in your social reports.
-
- LinkedIn audience and follower data from personal LinkedIn accounts.
Please note: due to LinkedIn's data retention policy, all LinkedIn data (impressions, clicks, interactions, etc.) will be deleted from HubSpot after 1 year. You can still view this data by logging in to your connected LinkedIn account.
Filter your social reports
Social reporting data will be limited by the post visibility settings of the accounts connected to that network. Generally, you can filter this data in your social reports by account, social network, date range, and associated campaign. However, the Audience, Sessions, and New Contacts reports cannot be filtered.
To filter your social reports:
- In your HubSpot account, navigate to Marketing > Social.
- At the top, click the Analyze tab.
- To filter by social network or account, in the top left, click the All accounts dropdown menu.
- To view data for individual accounts, select the account name.
- To view data for all of your connected social accounts, select All accounts.
- To view data for network accounts such as Facebook or LinkedIn, select the network name.
- At the top, you can also filter reports by:
- Date range: filter by this week, this month, the last 30 days, last month, this quarter, this year, or a custom time period. When filtering by date range, this data will be based on social post publish dates:
- If the selected date range is Last 30 days, social posts published more than 30 days ago will not factor into the reports, even if the posts are still receiving clicks and interactions.
- Campaign: filter by the campaign your social posts are associated with.
- Date range: filter by this week, this month, the last 30 days, last month, this quarter, this year, or a custom time period. When filtering by date range, this data will be based on social post publish dates:
- When comparing date ranges, data will be displayed for social posts published within the last date range compared to the currently selected date range. For example, if the date range is set to Last week, data for the week before that'll appear in the reports next to the current data.
-
- In each report, you can also review the count and percentage increase or decrease of the report metrics.
Save a report to your report library
You can save your social reports to your reports library. You can also add reports to a dashboard.
- In your HubSpot account, navigate to Marketing > Social.
- At the top, click the Analyze tab.
- In the top right of your report, click Save report.
- In the right panel, configure the following report details:
- Enter a report name.
- Enter a description of the report.
- Under Add this report to a dashboard, select the radio button to confirm whether you'd like to add the report to a dashboard:
- Don't add to dashboard: HubSpot won't add the report to any of your dashboards, but will save the report to your report library so you can use it later.
- Add to existing dashboard: you can select an existing dashboard to add the report to. When you select this option, you can select the dashboard from the dropdown menu.
- Add to new dashboard: you can create a new custom dashboard and add the social report to the new dashboard. When you select this option, you'll be prompted to enter a Dashboard name in the following step.
- In the bottom right, click Next or Save & add if you’re adding the report to an existing dashboard.
- If you aren’t adding the report to a dashboard, or you’re creating a new dashboard, under Who can access this report, select the radio button to set the report access.
- Reports that are added to existing dashboards will be controlled by the dashboard's access settings.
- In the bottom right, click Save or Save & add if you are adding the report to a dashboard.
Social reports available for all networks
Below are the reports available in the social tool for all social networks. Each report presents different engagement data, split out by network. To preview a sample report in the table below, hover over the generateChart report icon.
| Report Name | Metric | Description |
AudiencegenerateChart
|
Social network followers |
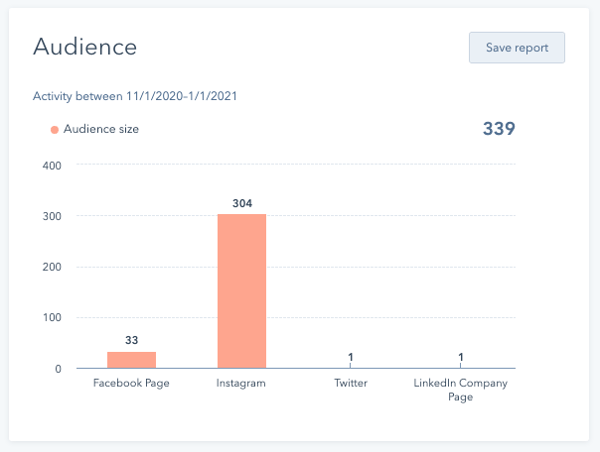
The Audience report shows your current number of followers, compared to the number you had in the previous time period, for each of your connected social accounts. When reviewing this report, please note the following:
|
Published PostsgenerateChart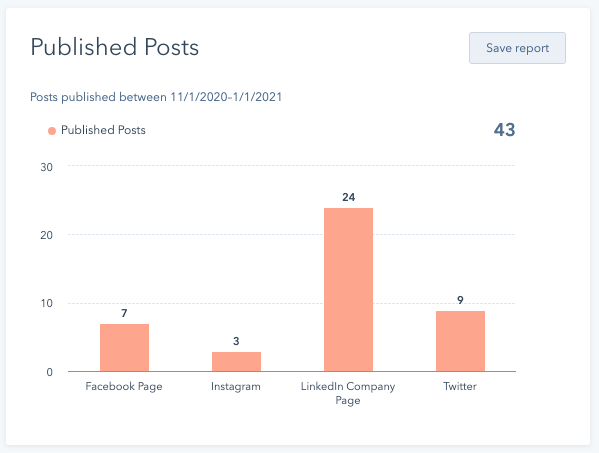
|
Published social posts
|
The Published Posts report shows the number of social posts that were published across your social accounts within the selected time period. This will also include posts that were published to your connected social accounts outside of HubSpot if this is selected in your social account settings. |
InteractionsgenerateChart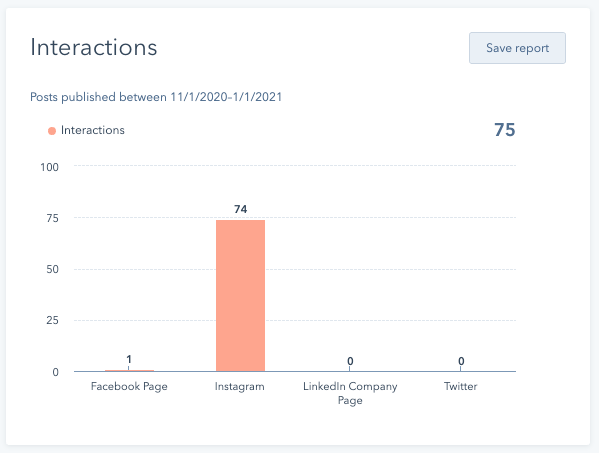
|
Social network interactions |
The Interactions report shows the number of likes, reactions (Facebook), and comments on your social posts published anywhere on your connected accounts. This will also include posts that were published to your connected social accounts outside of HubSpot if this is selected in your social account settings. Interactions can vary across each social network. Do take note of the following.
|
ClicksgenerateChart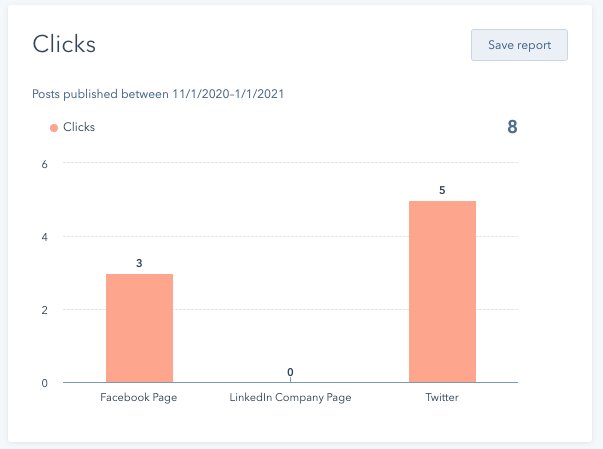
|
Clicks on social posts published through HubSpot | The Clicks report shows the number of clicks on social posts published through HubSpot. HubSpot can only track clicks for social posts published through HubSpot, as these posts use shortened link URLs to track clicks. HubSpot specifically counts clicks on the shortened URLs in posts. Click counts in this report may vary from what you see in your social media account:
|
SharesgenerateChart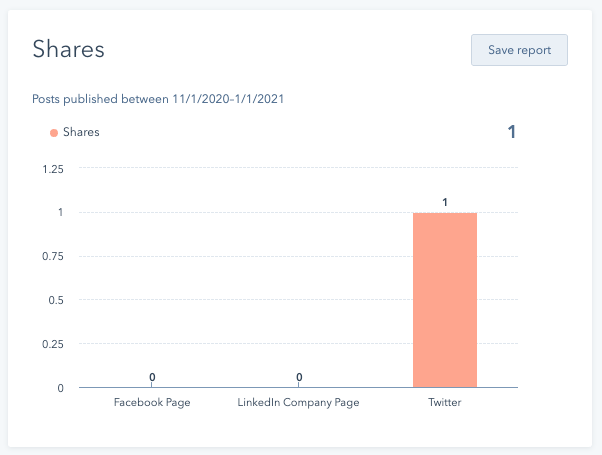
|
Social post shares and retweets | The Shares report shows the number of published social posts that were shared, including X reposts. Please note the following:
|
ImpressionsgenerateChart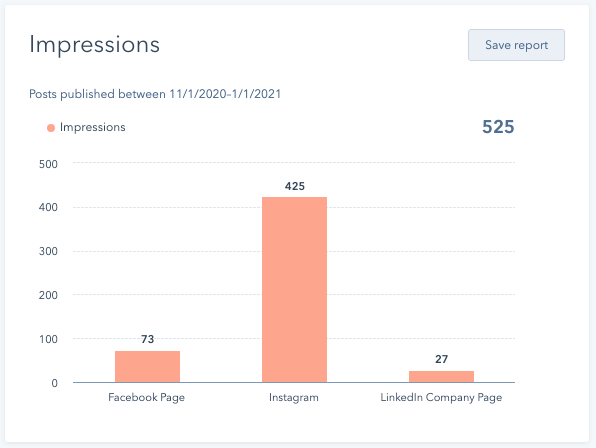
|
Views on your social posts | The Impressions report shows the number of views that social posts on your LinkedIn, Facebook, and Instagram company pages received. Please note the following:
|
SessionsgenerateChart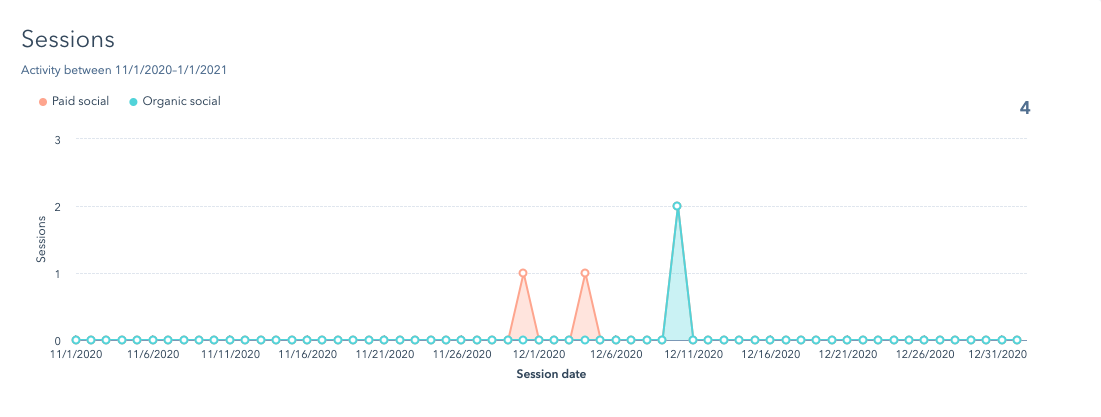
|
Web sessions from your social posts | The Sessions report shows the number of web sessions on your site (HubSpot-hosted web pages, or web pages that have your HubSpot tracking code installed) that took place within the selected time period that came from social media. Social posts that drove these sessions could have been published at any time, and from any social source. For example, if a third party publishes a LinkedIn post containing a link to your site, any clicks on that link will result in web sessions which will appear in the Sessions report. |
New ContactsgenerateChart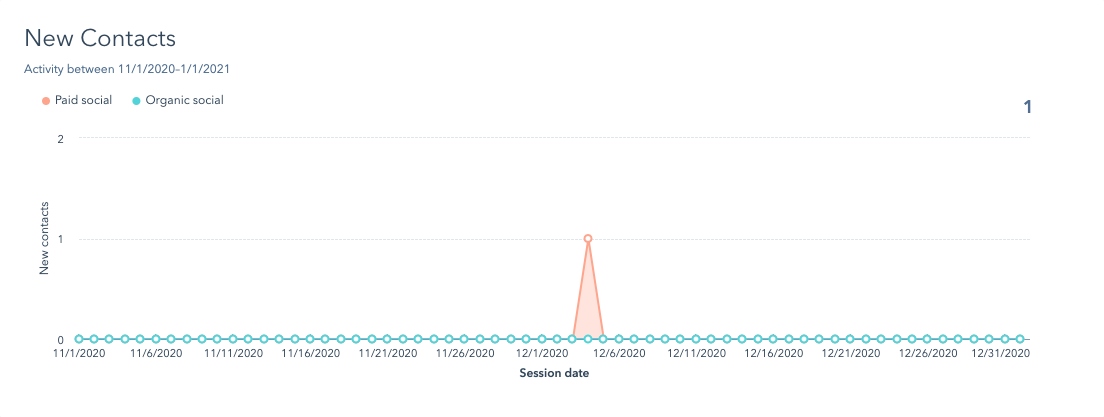
|
New contacts created from web sessions from your social posts | The New Contacts report shows the number of new contacts created in HubSpot as a result of web sessions driven by social media within the selected time period. |
Top postsgenerateChart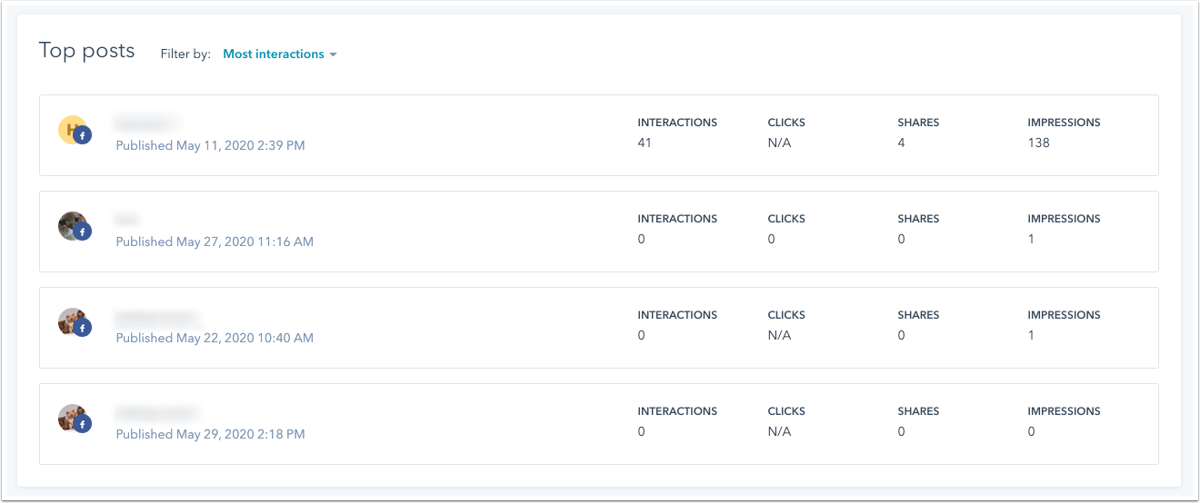
|
Top performing social posts | The Top Posts report shows a list of your top ten performing posts. You can see an overview of each post's interactions, clicks, shares, and impressions. From this report, you can do the following:
|
Social reports available for YouTube
Below are the reports available for YouTube. YouTube performance data cannot be filtered by individual YouTube accounts. The data displayed will be aggregated based on all connected accounts. To preview a sample report in the table below, hover over the generateChartreport icon.
| Report | Metric | Description |
YouTube OverviewgenerateChart
|
Subscribers, videos published, likes, dislikes, comments, shares, video views, average view duration, HubSpot sessions, and HubSpot contacts | The YouTube Overview report shows the total values for channel subscribers, videos published, likes, dislikes, comments, shares, video views, average view duration, HubSpot sessions, and HubSpot contacts. Each metric shows the percentage change from the previous time period. |
Watch timegenerateChart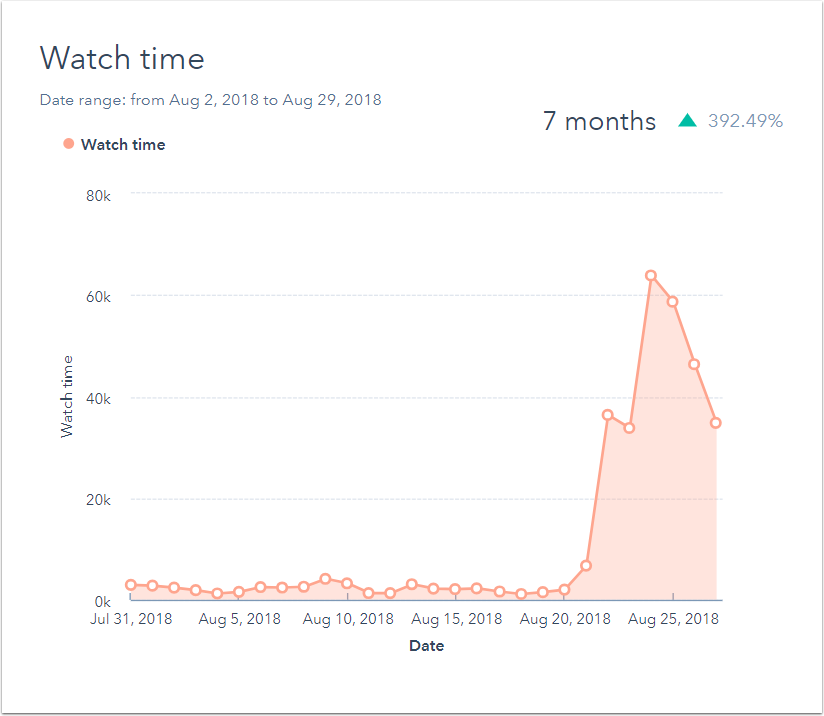
|
Watch time | The Watch time report shows the total watch time per day in minutes for the time period selected. |
ViewsgenerateChart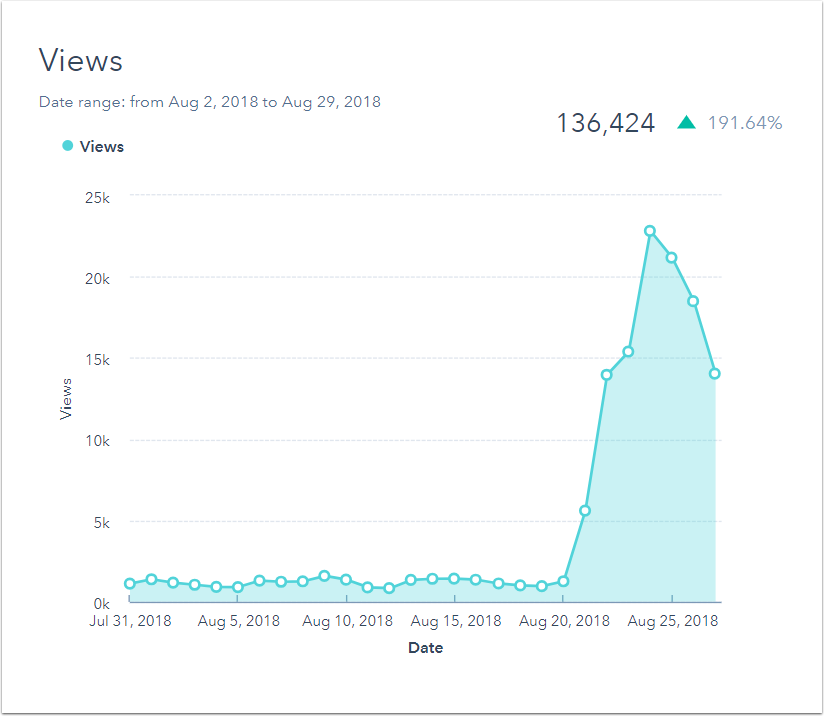
|
Views | The Views report shows the total views per day for the time period selected. |
InteractionsgenerateChart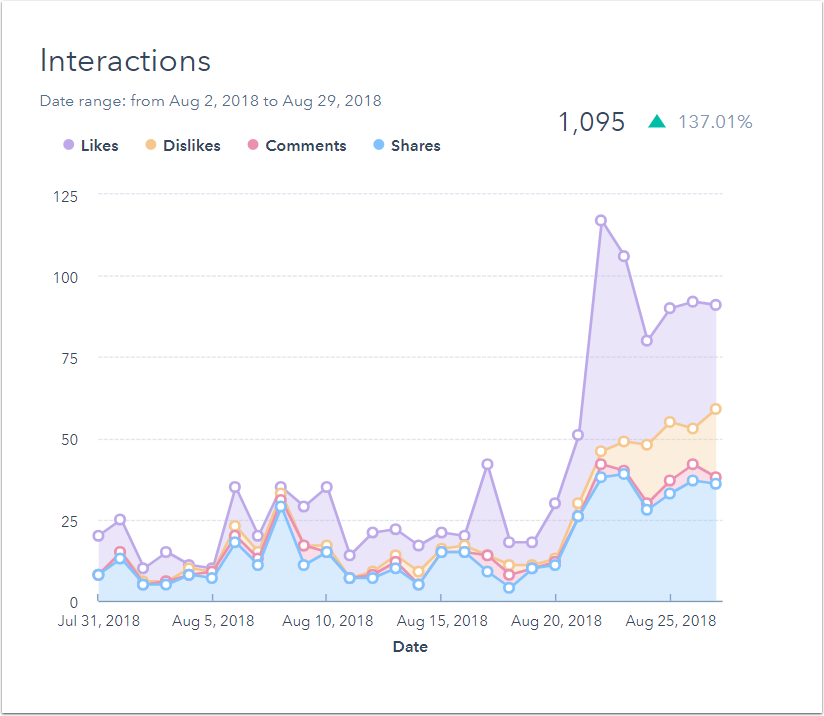
|
Likes, dislikes, comments, and shares | The Interactions report shows the number of likes, dislikes, comments, and shares per day that occurred during the time period selected. |
SubscribersgenerateChart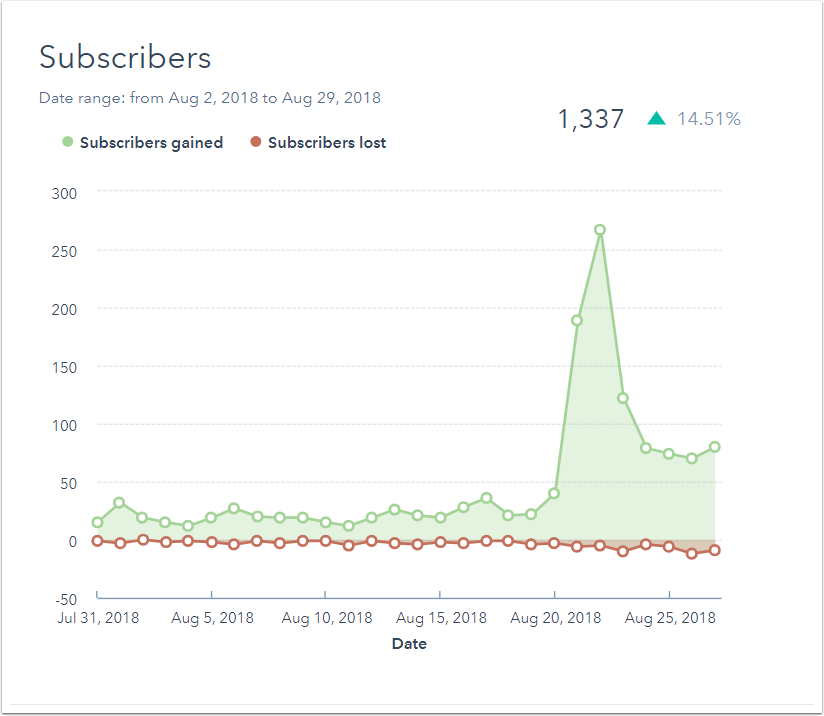
|
Subscribers | The Subscribers report shows the number of subscribers gained and lost per day for the time period selected. |
YouTube Post EngagementgenerateChart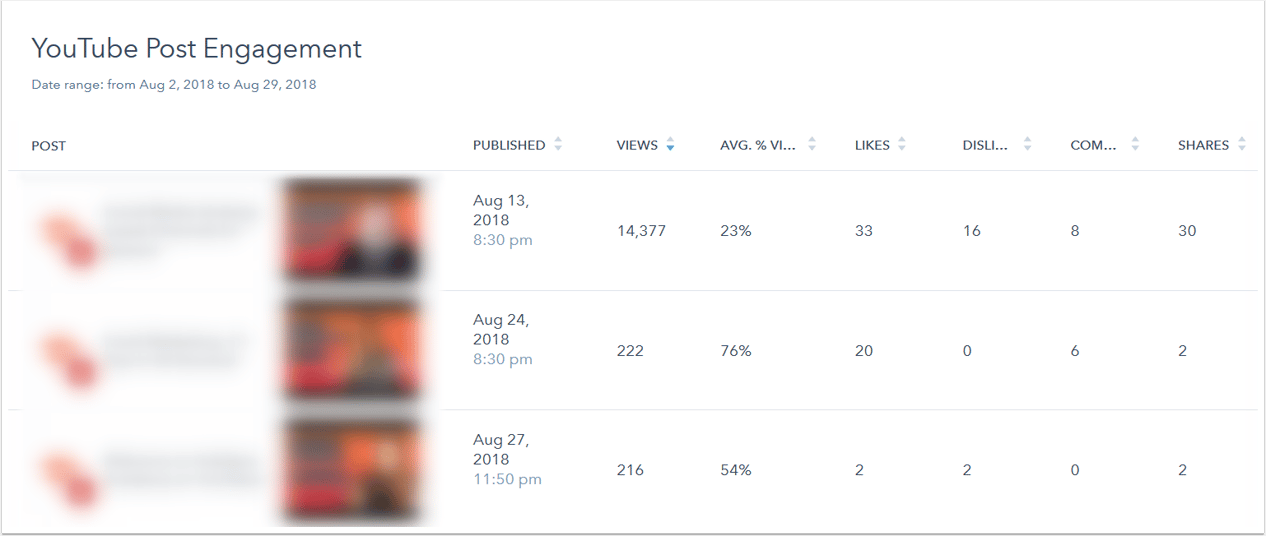
|
Views, average percentage viewed, likes, dislikes, comments, and shares | The YouTube Post Engagement report lists all the videos posted during the time period selected, along with the publish date and time, views, average percentage viewed (an average of how much of the video each person watched), likes, dislikes, comments, and shares. To sort the report by a specific metric, you can click the column header. |